Terminology
All analyses with hypeR must include one or more signatures and genesets.
Signature
There are multiple types of enrichment analyses (e.g. hypergeometric, kstest, gsea) one can perform. Depending on the type, different kinds of signatures are expected. There are three types of signatures hypeR() expects.
# Simply a character vector of symbols (hypergeometric)
signature <- c("GENE1", "GENE2", "GENE3")

# A ranked character vector of symbols (kstest)
ranked.signature <- c("GENE2", "GENE1", "GENE3")

# A ranked named numerical vector of symbols with ranking weights (gsea)
weighted.signature <- c("GENE2"=1.22, "GENE1"=0.94, "GENE3"=0.77)
Geneset
A geneset is simply a list of vectors, therefore, one can use any custom geneset in their analyses, as long as it’s appropriately defined. Additionally, hypeR() recognized object oriented genesets called gsets and rgsets objects, which are explained later in the documentation.
Usage
Example Data
In these tutorials, we will use example data. The example data includes pre-computed results from common gene expression analysis workflows such as diffential expression and weighted gene co-expression.
data(limma)Using a differential expression dataframe created with Limma, we will extract a signature of upregulated genes for use with a hypergeometric test and rank genes descending by their differential expression level for use with a kstest.
reactable(limma)Downloading Genesets
We’ll also import the latest genesets from Kegg using another set of functions provided by hypeR for downloading and loading hundreds of open source genesets.
genesets <- msigdb_gsets("Homo sapiens", "C2", "CP:KEGG")See Downloading Genesets for more information.
Performing Enrichment
All workflows begin with performing enrichment with hypeR(). Often we’re just interested in a single signature, as described above. In this case, hypeR() will return a hyp object. This object contains relevant information to the enrichment results, as well as plots for each geneset tested, and is recognized by downstream methods.
The most basic signature is an unranked vector of genes. This could be a differential expression signature, module of co-expressed genes, etc. As an example, we use the differential expression dataframe to filter genes that are upregulated (t > 0) and are sufficiently significant (fdr < 0.001), then extract the gene symbol column as a vector.
Unranked Signature
signature <- limma %>%
             dplyr::filter(t > 0 & fdr < 0.001) %>%
             magrittr::use_series(symbol)
length(signature)[1] 213
head(signature)[1] "LMAN2L" "SHKBP1" "SPHK2" "AJUBA" "TJP1" "TMCC3"
hyp_obj <- hypeR(signature, genesets, test="hypergeometric", background=50000, fdr=0.01, plotting=TRUE)
hyp_obj$plots[[1]]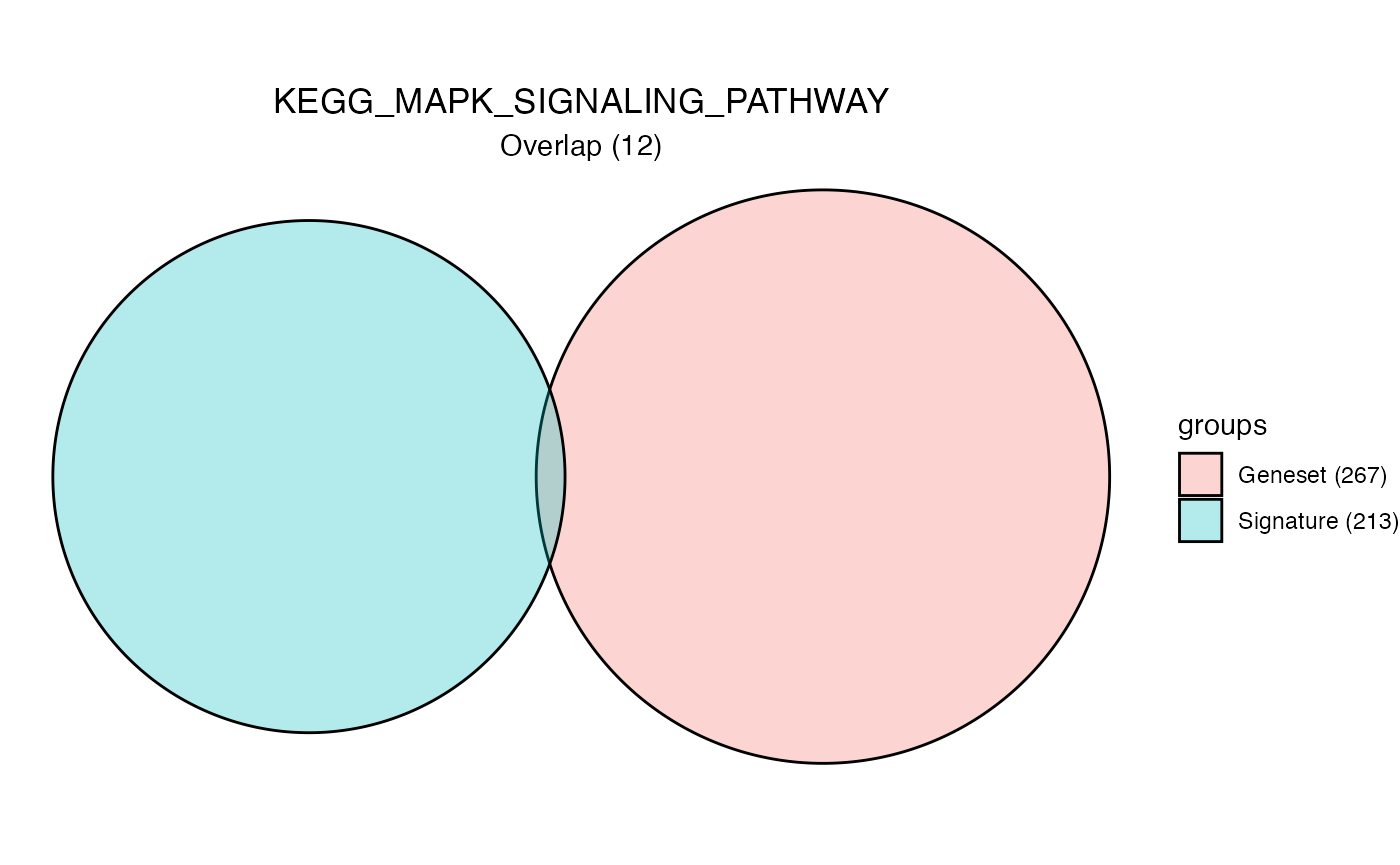
Ranked Signature
Rather than setting a specific cutoff to define a differential expression signature, one could rank genes by their expression and provide the entire ranked vector as signature. From the differential expression dataframe, we order genes descending so upregulated genes are near the top, then extract the gene symbol column as a vector.
signature <- limma %>%
             dplyr::arrange(desc(t)) %>%
             magrittr::use_series(symbol)
length(signature)[1] 9682
head(signature)[1] "LMAN2L" "SHKBP1" "SPHK2" "AJUBA" "TJP1" "TMCC3"
hyp_obj <- hypeR(signature, genesets, test="kstest", fdr=0.05, plotting=TRUE)
hyp_obj$plots[[1]]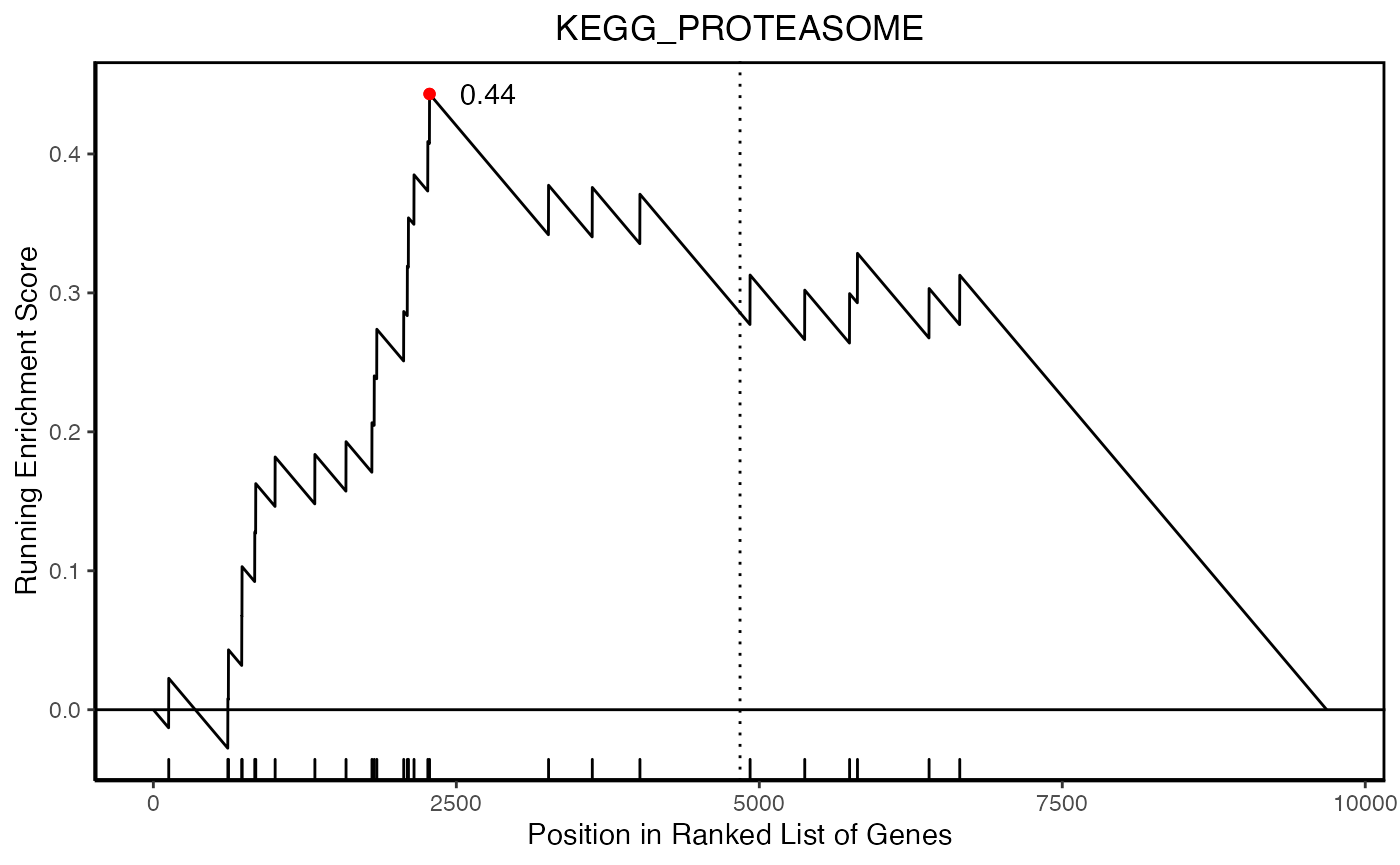
Weighted Signature
In addition to providing a ranked signature, one could also add weights by including the t-statistic of the differential expression. From the differential expression dataframe, we order genes descending so upregulated genes are near the top, then extract and deframe the gene symbol and t-statistic columns as a named vector of weights.
length(signature)[1] 9682
head(signature)LMAN2L SHKBP1 SPHK2 AJUBA TJP1 TMCC3
6.59 6.56 6.37 6.26 6.26 6.11
hyp_obj <- hypeR(signature, genesets, test="kstest", fdr=0.05, plotting=TRUE)
hyp_obj$plots[[1]]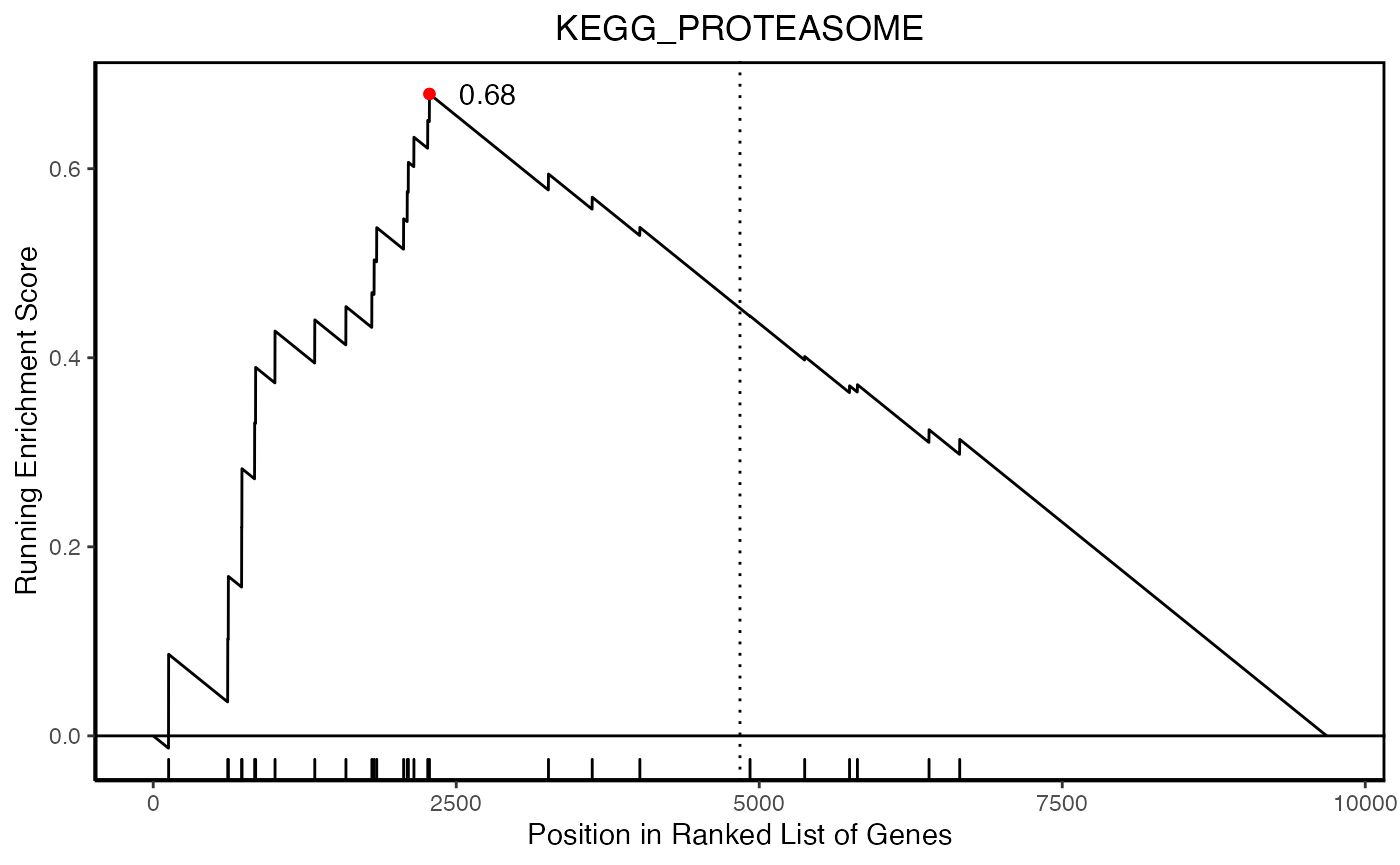
For permutation-based significance testing and normalized enrichment scores, please see here.
Downstream Analysis
The hyp Object
A hyp object contains all information relevant to the enrichment analysis, including the parameters used, a dataframe of results, plots for each geneset tested, as well as the arguments used to perform the analysis. All downstream functions used for analysis, visualization, and reporting recognize hyp objects and utilize their data. Adopting an object oriented framework brings modularity to hypeR, enabling flexible and reproducible workflows.
print(hyp_obj)(hyp)
data:
label pval fdr signature geneset overlap
KEGG_PROTEASOME 1.7e-05 0.0032 9682 46 28
KEGG_STEROID_BIOSYNTHESIS 6.4e-05 0.0060 9682 17 12
KEGG_PANCREATIC_CANCER 1.8e-04 0.0098 9682 70 49
KEGG_NEUROTROPHIN_SIGNALING_PATHWAY 2.1e-04 0.0098 9682 126 87
KEGG_FC_GAMMA_R_MEDIATED_PHAGOCYTOSIS 4.8e-04 0.0180 9682 96 62
KEGG_RENAL_CELL_CARCINOMA 6.6e-04 0.0200 9682 70 47
score
0.68
0.82
0.50
0.49
0.47
0.41
plots: 11 Figures
args: signature
genesets
test
background
power
absolute
pval
fdr
plotting
quietAll data related to enrichment arguments, parameters, and results and stored into a single hyp object. Saving your hyp objects will enable reproducible enrichment workflows.
hyp_obj$info$hypeR
[1] "v1.7.2"
$`Signature Head`
[1] "LMAN2L,SHKBP1,SPHK2,AJUBA,TJP1,TMCC3"
$`Signature Size`
[1] "9682"
$`Signature Type`
[1] "weighted"
$Genesets
[1] "C2.CP:KEGG v7.2.1"
$Background
[1] "23467"
$`P-Value`
[1] "1"
$FDR
[1] "0.05"
$Test
[1] "kstest"
$Power
[1] "1"
$Absolute
[1] "FALSE"
The hyp Methods
# Show interactive table
hyp_show(hyp_obj)

# Plot dots plot
hyp_dots(hyp_obj)

# Plot enrichment map
hyp_emap(hyp_obj)

# Plot hiearchy map (relational genesets)
hyp_hmap(hyp_obj)

# Map enrichment to an igraph object (relational genesets)
hyp_to_graph(hyp_obj)

# Save to excel
hyp_to_excel(hyp_obj)

# Save to table
hyp_to_table(hyp_obj)

# Generate markdown report
hyp_to_rmd(hyp_obj)
Continue to Visualize Results to see these methods in action.