Example Data
The example data includes a pre-computed differential expression dataframe from limma. From the differential expression dataframe, we order genes descending so upregulated genes are near the top, then extract the gene symbol column as a vector.
data(limma)

signature <- limma %>%
             dplyr::arrange(desc(t)) %>%
             magrittr::use_series(symbol)

head(signature)
[1] "LMAN2L" "SHKBP1" "SPHK2" "AJUBA" "TJP1" "TMCC3"
genesets <- msigdb_gsets("Homo sapiens", "C2", "CP:REACTOME", clean=TRUE)

hyp_obj <- hypeR(signature, genesets, test="kstest", fdr=0.01)
To visualize the results, just pass the hyp object to any downstream functions.
Dots Plot
One can visualize the top enriched genesets using hyp_dots() which returns a horizontal dots plot. Each dot is a geneset, where the color represents the significance and the size signifies the geneset size.
hyp_dots(hyp_obj)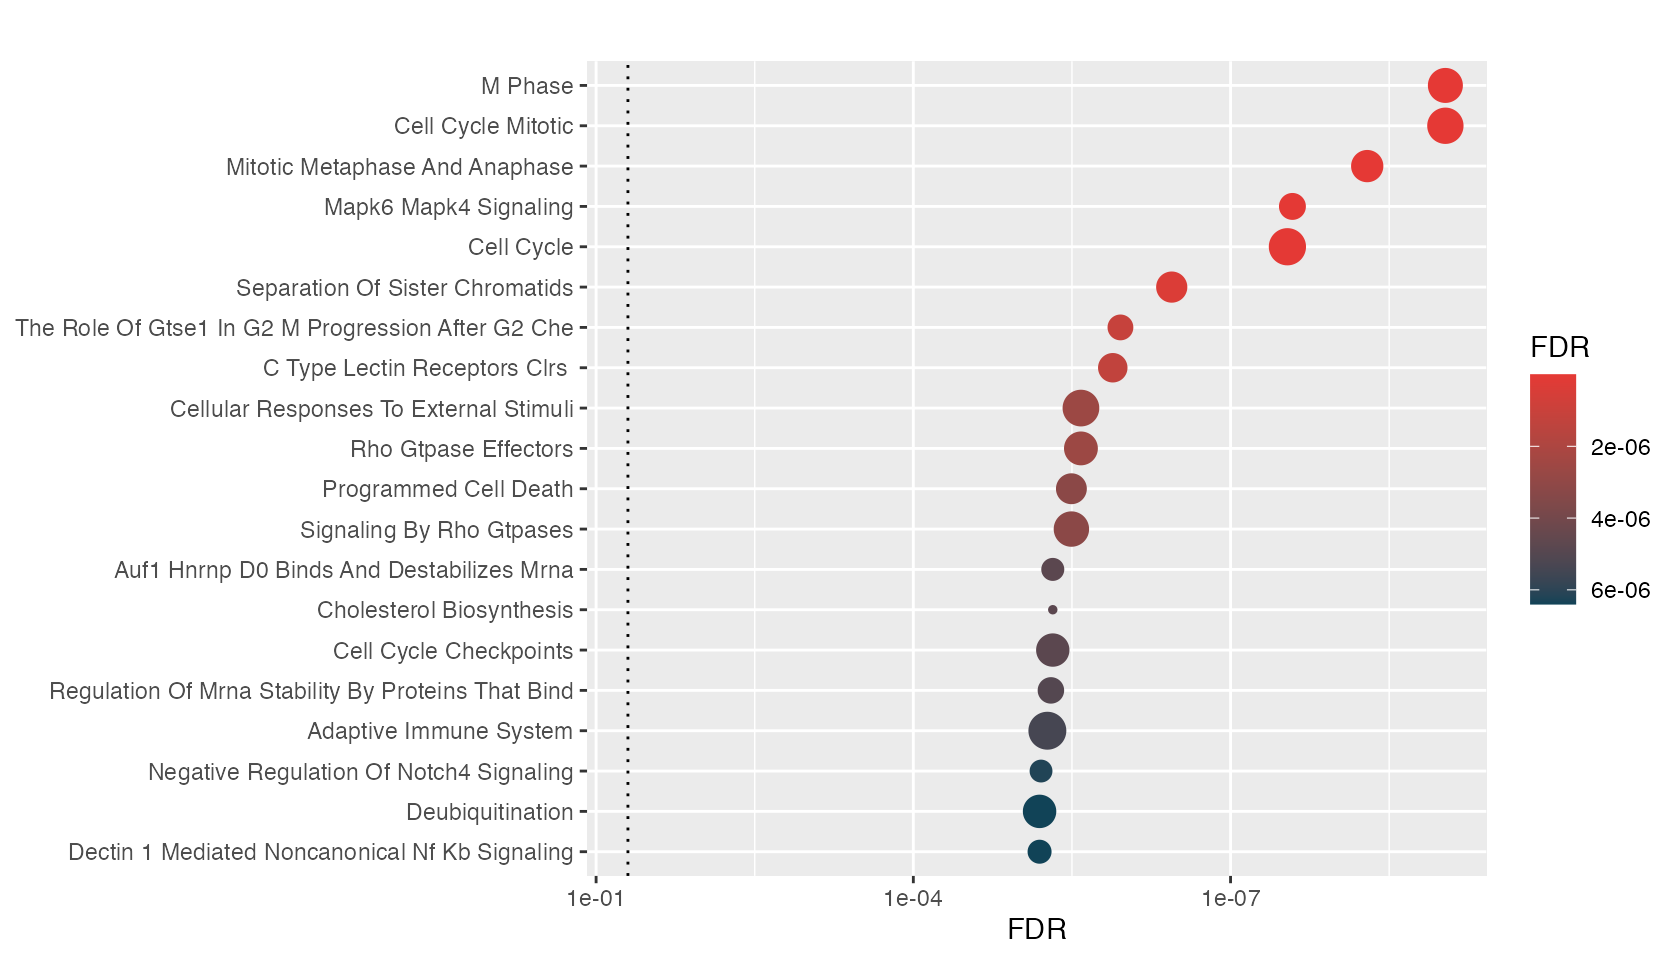
Enrichment Map
One can visualize the top enriched genesets using hyp_emap() which will return an enrichment map. Each node represents a geneset, where the shade of red indicates the normalized significance of enrichment. Hover over the node to view the raw value. Edges represent geneset similarity, calculated by either jaccard or overlap similarity metrics.
hyp_emap(hyp_obj, similarity_cutoff=0.70)Hiearchy Map
When dealing with hundreds of genesets, it’s often useful to understand the relationships between them. This allows researchers to summarize many enriched pathways as more general biological processes. To do this, we rely on curated relationships defined between them.
Relational Genesets
For example, Reactome conveniently defines their genesets in a hiearchy of pathways. This data can be formatted into a relational genesets object called rgsets.
genesets <- hyperdb_rgsets("REACTOME", version="70.0")Relational genesets have three data atrributes including gsets, nodes, and edges. The genesets attribute includes the geneset information for the leaf nodes of the hiearchy, the nodes attribute describes all nodes in the hierarchy, including internal nodes, and the edges attribute describes the edges in the hiearchy.
print(genesets)REACTOME v70.0
Genesets
2-LTR circle formation (13)
5-Phosphoribose 1-diphosphate biosynthesis (3)
A tetrasaccharide linker sequence is required for GAG synthesis (26)
ABC transporters in lipid homeostasis (18)
ABO blood group biosynthesis (3)
ADP signalling through P2Y purinoceptor 1 (25)
Nodes
label
R-HSA-164843 2-LTR circle formation
R-HSA-73843 5-Phosphoribose 1-diphosphate biosynthesis
R-HSA-1971475 A tetrasaccharide linker sequence is required for GAG synthesis
R-HSA-5619084 ABC transporter disorders
R-HSA-1369062 ABC transporters in lipid homeostasis
R-HSA-382556 ABC-family proteins mediated transport
id length
R-HSA-164843 R-HSA-164843 13
R-HSA-73843 R-HSA-73843 3
R-HSA-1971475 R-HSA-1971475 26
R-HSA-5619084 R-HSA-5619084 77
R-HSA-1369062 R-HSA-1369062 18
R-HSA-382556 R-HSA-382556 22
Edges
from to
1 R-HSA-109581 R-HSA-109606
2 R-HSA-109581 R-HSA-169911
3 R-HSA-109581 R-HSA-5357769
4 R-HSA-109581 R-HSA-75153
5 R-HSA-109582 R-HSA-140877
6 R-HSA-109582 R-HSA-202733Passing relational genesets works natively with hypeR().
hyp_obj <- hypeR(signature, genesets, test="kstest", fdr=0.01)One can visualize the top enriched genesets using hyp_hmap() which will return a hierarchy map. Each node represents a geneset, where the shade of the gold border indicates the normalized significance of enrichment. Hover over the leaf nodes to view the raw value. Double click internal nodes to cluster their first degree connections. Edges represent a directed relationship between genesets in the hiearchy. Note: This function only works when the hyp object was initialized with an rgsets object.
hyp_hmap(hyp_obj, top=30)