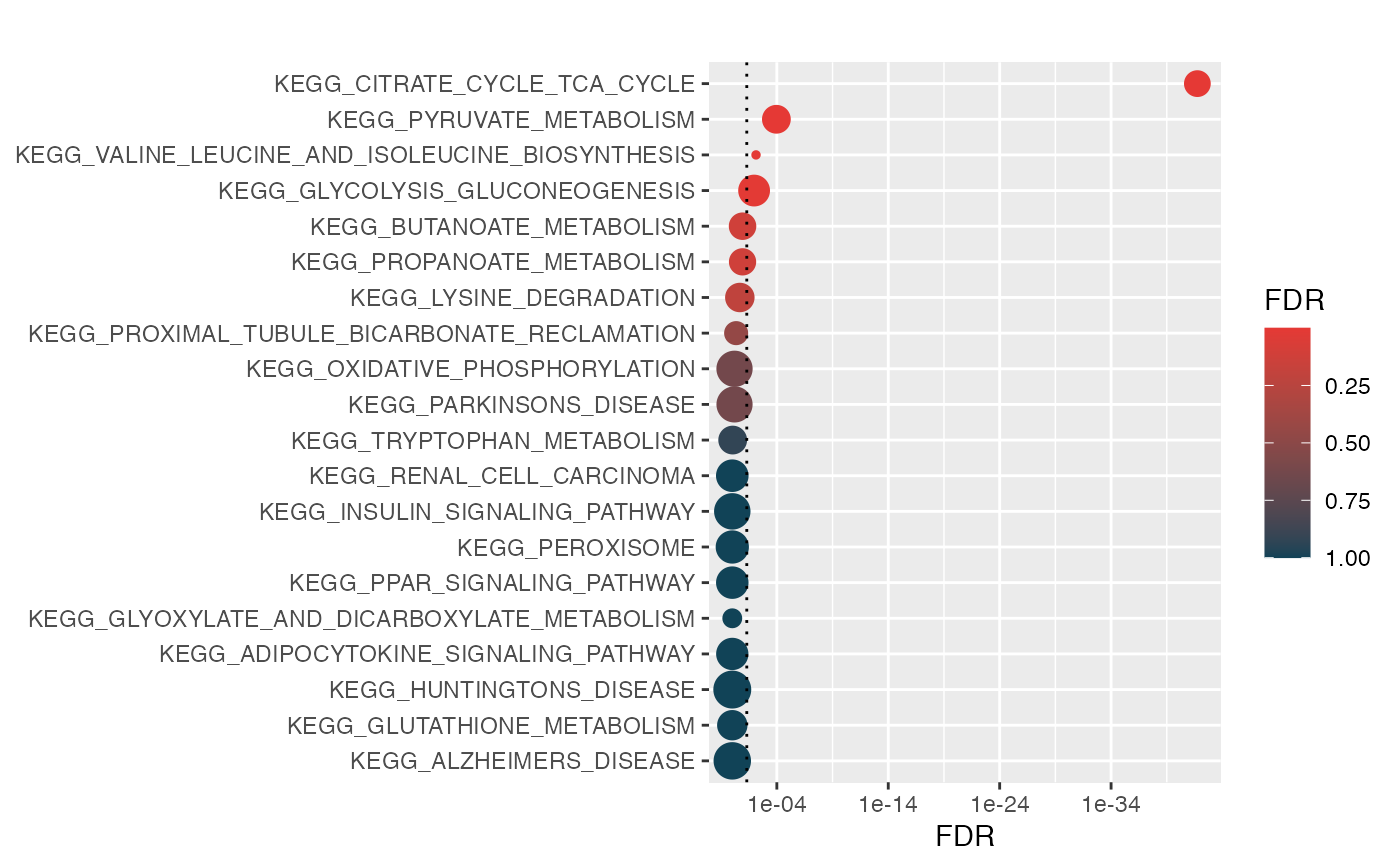
Visualize hyp/multihyp objects as a dots plot
hyp_dots(
  hyp_obj,
  top = 20,
  abrv = 50,
  sizes = TRUE,
  pval = 1,
  fdr = 1,
  val = c("fdr", "pval"),
  title = "",
  merge = FALSE
)
Arguments
| hyp_obj | A hyp or multihyp object |
|---|---|
| top | Limit number of genesets shown |
| abrv | Abbreviation length of geneset labels |
| sizes | Size dots by geneset sizes |
| pval | Filter results to be less than pval cutoff |
| fdr | Filter results to be less than fdr cutoff |
| val | Choose significance value for plot e.g. c("fdr", "pval") |
| title | Plot title |
| merge | Use true to merge a multihyp object into one plot |
Value
A ggplot object
Examples
genesets <- msigdb_gsets("Homo sapiens", "C2", "CP:KEGG")

signature <- c("IDH3B","DLST","PCK2","CS","PDHB","PCK1","PDHA1","LOC642502",
               "PDHA2","LOC283398","FH","SDHD","OGDH","SDHB","IDH3A","SDHC",
               "IDH2","IDH1","OGDHL","PC","SDHA","SUCLG1","SUCLA2","SUCLG2")

hyp_obj <- hypeR(signature, genesets, background=2522)

hyp_dots(hyp_obj, val="fdr")