Running K2Taxonomer on Single-cell RNA Sequencing Data
Eric R. Reed
March 25, 2025
Source:vignettes/01_K2Taxonomer_singlecell.Rmd
01_K2Taxonomer_singlecell.RmdIntroduction
This vignette describes the workflow for running K2Taxonomer recursive partitioning on single-cell gene expression data (Reed and Monti 2021). Note, that many of these steps are shared with that of bulk expression analyses. A vignette for running K2Taxonomer on bulk expression data can be found here.
The single-cell expression workflow performs partitioning at the level of annotated cell clusters and/or cell types. Note, for recursive partitioning it is recommended to use the same data matrix from which clustering tasks were performed, such as an integrated data matrix generated prior to and used for clustering. For tasks downstream of partitioning, users can specify an alternative data matrix.
Running K2Taxonomer
Get necessary data objects
## Integrated expression matrix used for clustering data
integrated_expression_matrix <- ifnb_small@assays$integrated$scale.data

## Normalized expression matrix to be used for downstream analyses
normalized_expression_matrix <- ifnb_small@assays$SCT$data

## Profile-level information
cell_data <- ifnb_small@meta.data
Initialize K2 object
The K2preproc() initializes the K2 object
and runs pre-processing steps. Here, you can specify all arguments used
throughout the analysis. Otherwise, you can specify these arguments
within the specific functions for which they are implemented. See help
pages for more information.
A description of arguments implemented in this vignette are
- object: “Expression Matrix”: Expression matrix to be used for partioning.
-
eMatDS: “Expression Matrix”: Optional: Expression
matrix to be used for downstream analysis. This is useful if the matrix
in object is comprised of data that has been
integratedacross experiments/samples because these are generally considered insufficent for statistical analyses of singe-cell gene expression. - colData: “Data Frame”: A data frame which contains a row for each profile (i.e. columns in object).
- cohorts: “String”: A column name in colData. This column specifies the cluster/cell type annotations for each profile.
- nBoots: “Integer”: The number of bootstraps to run at each partition.
- clustFunc: “String” or “Function”: The partitioning function to use. If a string, the function will be selected from built-in functions.
- genesets: “Named List”: A named list of gene sets to be used for downstream annotation.
# Initialize `K2` object
K2res <- K2preproc(object = integrated_expression_matrix,
                   eMatDS = normalized_expression_matrix,
                   colData = cell_data,
                   cohorts="cell_type",
                   nBoots = 200,
                   clustFunc = "cKmeansDownsampleSqrt",
                   genesets = cellMarker2_genesets)
Run recursive partitioning algorithm
The K2Taxonomer is
run by K2tax(). At each recursion of the algorithm, the
observations are partitioned into two sub-groups based on a compilation
of repeated K=2 clustering on bootstrapped sampling of features.
K2res <- K2tax(K2res)Generate dendrogram from K2Taxonomer results
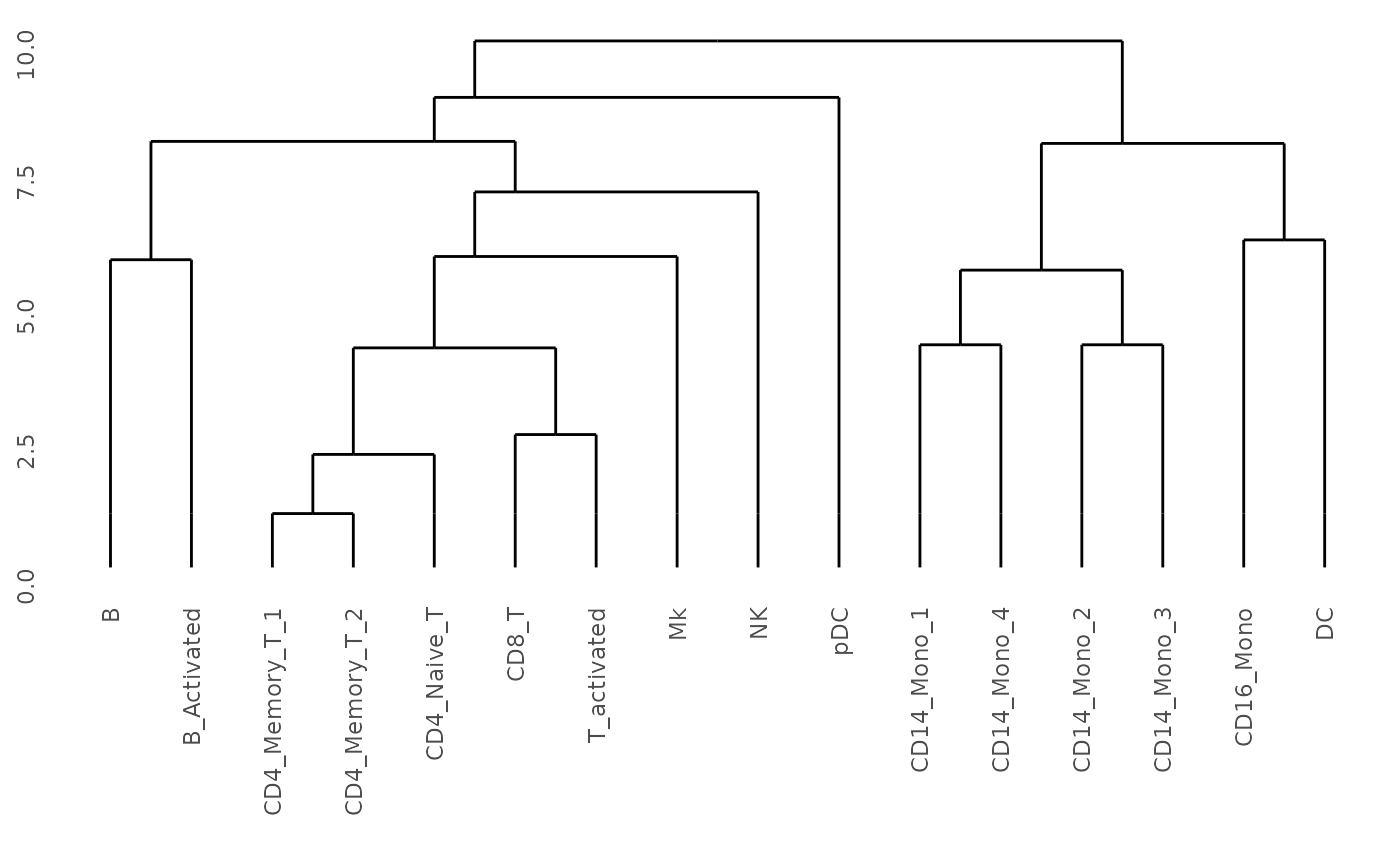
Static dendrogram
## Get dendrogram from K2Taxonomer
dendro <- K2dendro(K2res)

## Plot dendrogram
ggdendrogram(dendro)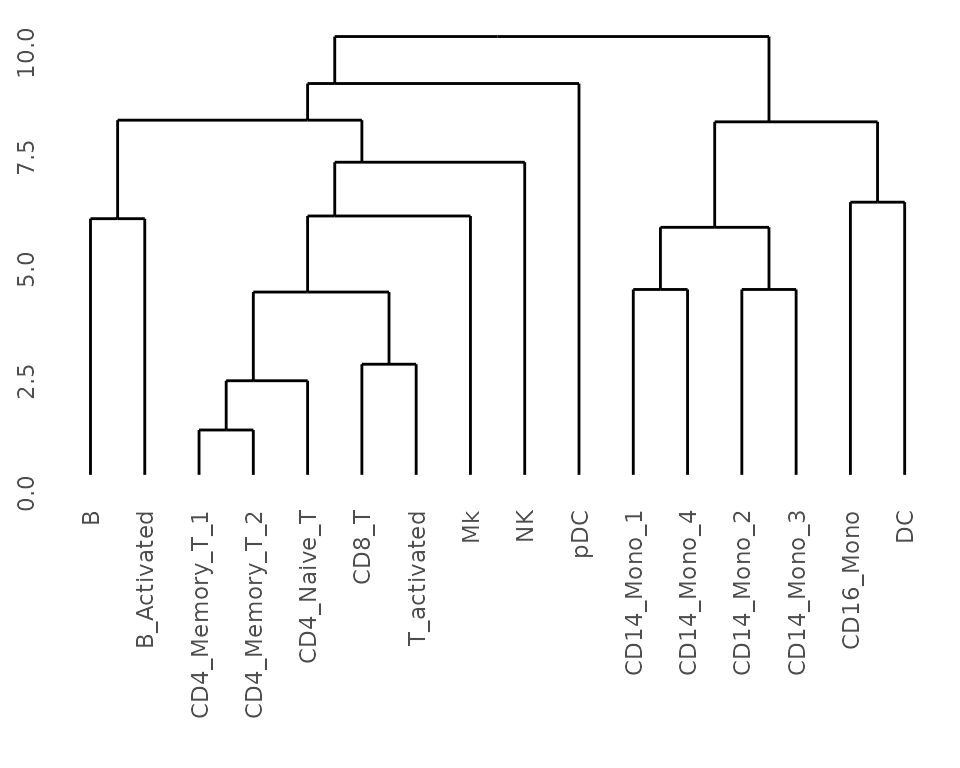
Interactive dendrogram
K2visNetwork(K2res)Annotate K2Taxonomer results
Partition-level Differential Gene Expression Analysis
K2res <- runDGEmods(K2res)
#> Running DGE for partition:
#>   1 / 15
#>   2 / 15
#>   3 / 15
#>   4 / 15
#>   5 / 15
#>   6 / 15
#>   7 / 15
#>   8 / 15
#>   9 / 15
#>   10 / 15
#>   11 / 15
#>   12 / 15
#>   13 / 15
#>   14 / 15
#>   15 / 15
Perform gene set based analyses
### Perform Fisher Exact Test based over-representation analysis
K2res <- runFISHERmods(K2res)

### Perform single-sample gene set scoring
K2res <- runScoreGeneSets(K2res)
#> Scoring gene sets with GSVA.

### Perform partition-level differential gene set score analysis
K2res <- runDSSEmods(K2res)
#> Running different enrichment score for partition:
#>   1 / 15
#>   2 / 15
#>   3 / 15
#>   4 / 15
#>   5 / 15
#>   6 / 15
#>   7 / 15
#>   8 / 15
#>   9 / 15
#>   10 / 15
#>   11 / 15
#>   12 / 15
#>   13 / 15
#>   14 / 15
#>   15 / 15
Explore Annotation Results
Partition-level Differential Gene Expression Analysis
Create Static Table of DGE Results
DGEtable <- getDGETable(K2res)
head(DGEtable)
#>       gene     coef      mean        t       df pval fdr edge node direction
#> 1      FTL 2.779654 2.6534606 58.00984 1594.629    0   0    2    A        up
#> 2    TIMP1 2.394971 1.0806257 66.56321 1610.346    0   0    2    A        up
#> 3  HLA-DRA 2.230605 0.5719218 62.69911 1117.113    0   0    1    D        up
#> 4 C15orf48 2.015372 0.8097896 71.48105 1711.519    0   0    2    A        up
#> 5     SOD2 1.901742 0.8700197 61.28335 1711.519    0   0    2    A        up
#> 6   TYROBP 1.808682 0.8001095 86.60850 1711.519    0   0    2    A        up
Create Interactive Table of DGE Results
getDGEInter(K2res, minDiff = 1, node = c("A"), pagelength = 10)Create Plot of Gene Expression
plotGenePathway(K2res, feature = "FTL", node = "A")Create Static Plot Gene Expression
plotGenePathway(K2res, feature = "FTL", node = "A", use_plotly = FALSE)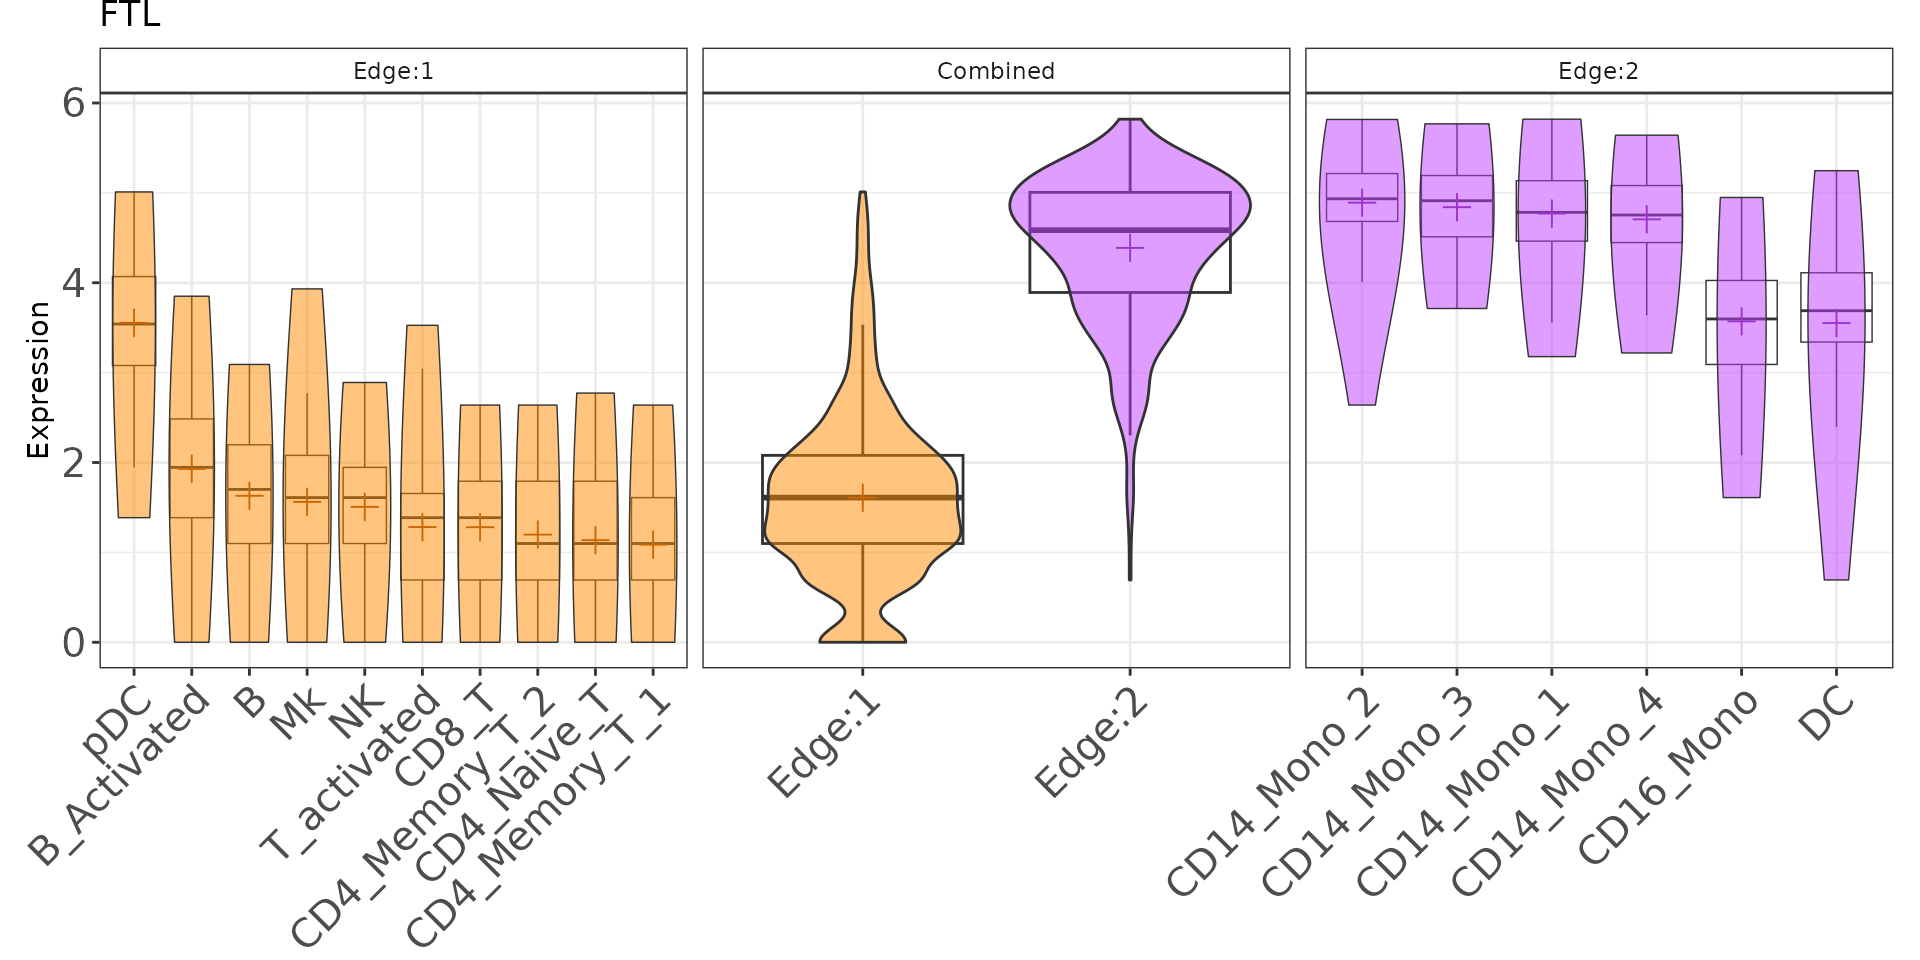
Partition-level Gene Set Enrichment Results
Create Static Table of Gene Set Results
ENRtable <- getEnrichmentTable(K2res)
head(ENRtable)
#>             category node edge direction  pval_fisher   fdr_fisher nhits ndrawn
#> 1           Monocyte    A    2        up 7.911659e-21 5.957479e-18    19    409
#> 2      Memory T cell    A    2        up 1.907696e-09 1.411695e-06     6    409
#> 3 Classical monocyte    A    2        up 1.103540e-25 8.320692e-23    20    409
#> 4      Megakaryocyte    K    2        up 8.468647e-08 6.156706e-05     3     24
#> 5        Plasma cell    B    2        up 9.471424e-07 6.838368e-04     5    568
#> 6  Naive T(Th0) cell    A    1        up 6.009134e-09 4.410705e-06     6    252
#>   ncats  ntot    pval_limma     fdr_limma      coef         mean        t
#> 1    45 20000  0.000000e+00  0.000000e+00 0.2018242 -0.086154856 63.88109
#> 2     8 20000 1.647588e-266 6.409119e-264 0.4223627  0.307262110 42.70548
#> 3    34 20000 5.525036e-257 2.143714e-254 0.3217500  0.006649857 41.60726
#> 4     8 20000 8.372527e-213 3.240168e-210 0.5158528  0.129441602 49.19827
#> 5     8 20000 1.260235e-161 4.864509e-159 0.2169172  0.024323970 32.94303
#> 6    13 20000 6.229656e-134 2.398417e-131 0.2300017  0.024572373 27.16614
#>                                                                                                                                         hits
#> 1                                 C5AR1,CD14,CD38,CD68,CD86,CREG1,CST3,FCGR3A,FGL2,LYZ,MNDA,MS4A7,OAZ1,PSAP,S100A6,S100A8,S100A9,SOD2,TYROBP
#> 2                                                                                                 LGALS1,LGALS3,MYL12A,S100A10,S100A4,S100A6
#> 3 CD14,CD74,CDKN1A,CYP1B1,EPSTI1,FCGR3A,FCN1,HLA-DPA1,HLA-DPB1,HLA-DQA1,HLA-DQB1,HLA-DRA,HLA-DRB1,IFIT2,IFIT3,IFITM3,ISG15,LYZ,S100A8,S100A9
#> 4                                                                                                                             PF4,PPBP,TUBB1
#> 5                                                                                                                    CD38,IGJ,IRF4,MZB1,XBP1
#> 6                                                                                                             CCR7,CD3D,HSPD1,NPM1,PTMA,SELL
Create Interactive Table of Gene Set Results
getEnrichmentInter(K2res, nodes = c("A"), pagelength = 10)Create Interactive Plot of Single-sample Scoring
plotGenePathway(K2res, feature = "Monocyte", node = "A", type = "gMat")Create Static Plot of Single-sample Scoring
plotGenePathway(K2res, feature = "Monocyte", node = "A", type = "gMat", use_plotly = FALSE)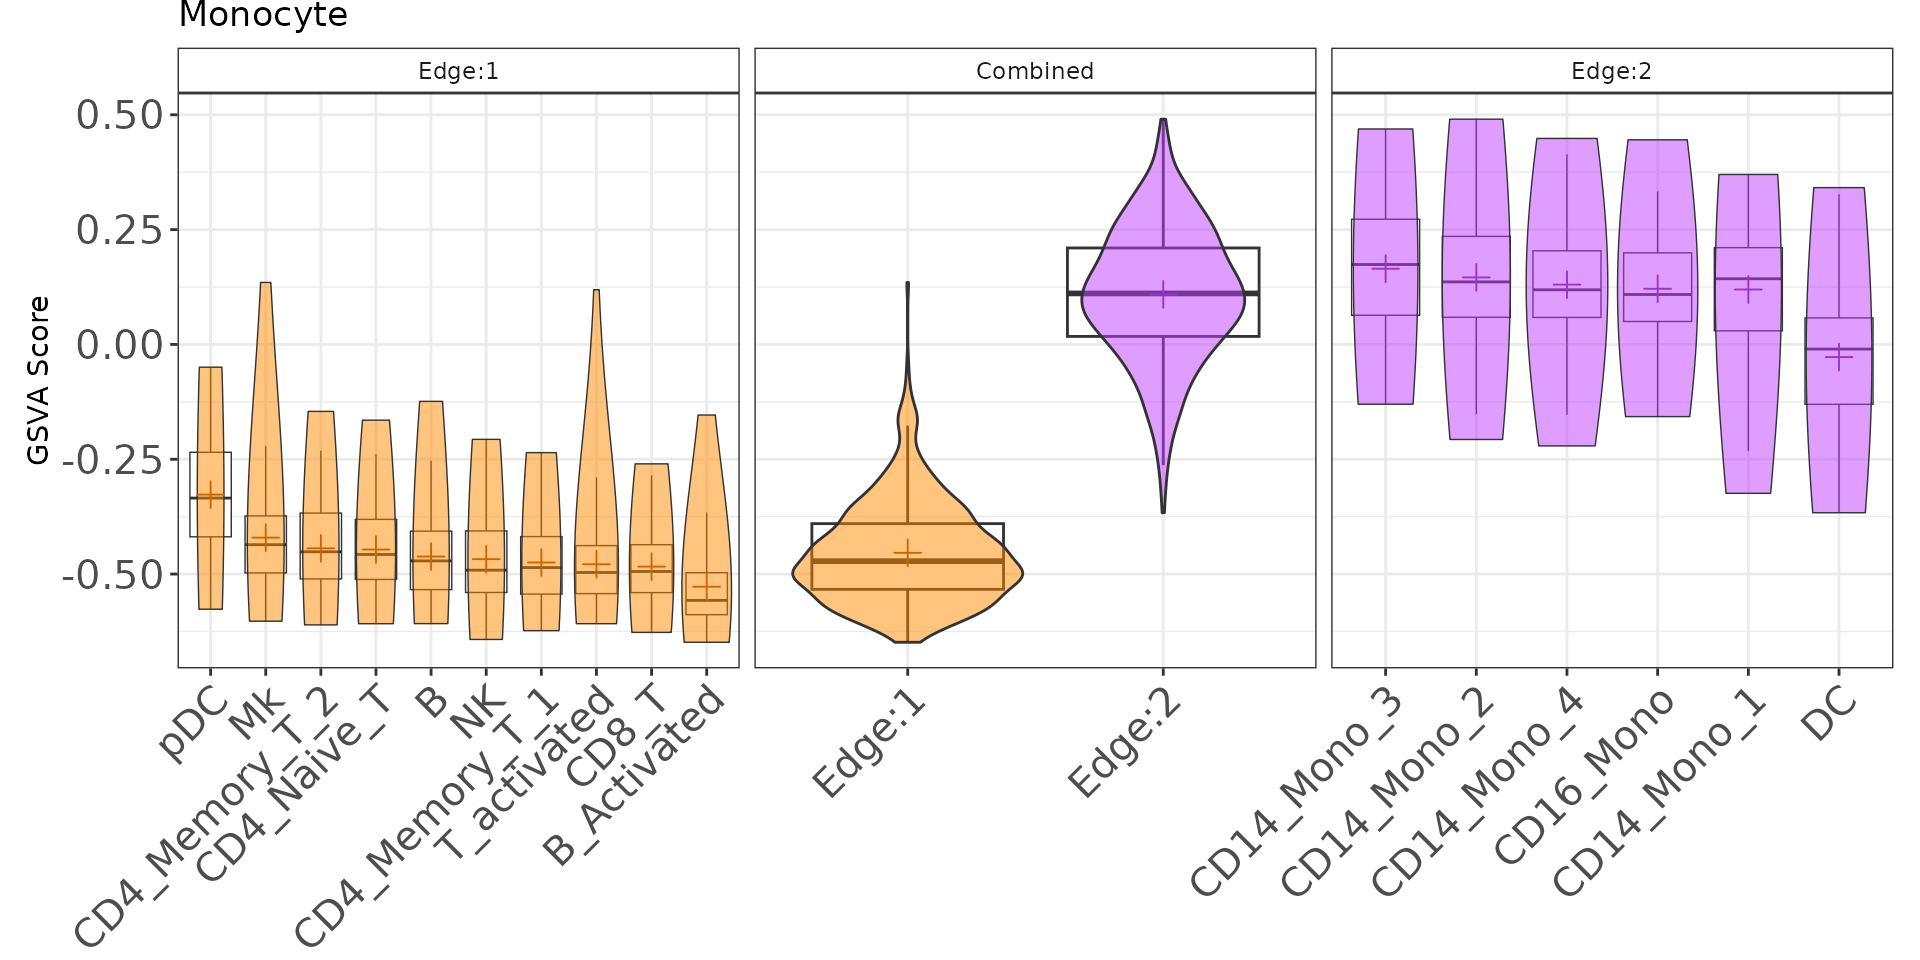
Create Dashboard
For more information about K2Taxonomer dashboards, read this vignette.
# Not run
K2dashboard(K2res, "K2results_ifnb_small")
Implementation Options
Parellel excecutation
Given their size, parts of the K2Taxonomer workflow can take a long
time with single-cell data sets. Accordingly, it is generally
recommended to run the workflow using parallel computing. This can be
implemented easily by setting the useCors argument in
K2preproc()
# Not run
K2res <- K2preproc(object = integrated_expression_matrix,
                   eMatDS = normalized_expression_matrix,
                   colData = cell_data,
                   cohorts="cell_type",
                   nBoots = 200,
                   useCors = 8, ## Runs K2Taxonomer in parellel with eight cores.
                   clustFunc = "cKmeansDownsampleSqrt",
                   genesets = cellMarker2_genesets)
Using Seurat object directly
In addition to expression matrices, Seurat objects may
be input directly with the object argument. When
implemented, colData isn’t specified and this
information is pulled from the meta data of the Seurat
object. Two additional arguments may be set, each specifying the
assay of the Seurat objects to pull expression
data from.
- seuAssay: “String”: Name of Seurat assay to pull expression data for recursive partitioning. The ‘scale.data’ slot will be pulled from this assay.
- seuAssayDS: “String”: Name of Seurat assay to pull expression data for downstream analysis. The ‘data’ slot will be pulled from this assay.
K2res_seurat <- K2preproc(object = ifnb_small,
                   cohorts="cell_type",
                   seuAssay = "integrated",
                   seuAssayDS = "SCT",
                   nBoots = 200,
                   clustFunc = "cKmeansDownsampleSqrt",
                   genesets = cellMarker2_genesets)

## Run recursive partitioning algorithm
K2res_seurat <- K2tax(K2res_seurat)

## Get dendrogram from K2Taxonomer
dendro_seurat <- K2dendro(K2res_seurat)

## Plot dendrogram
ggdendrogram(dendro_seurat)