Enrichment of a single community
Enrichment is performed independently for each community. Rather than performing enrichment just on the community members, we want to account for neighboring members outside but within close proximity to the community. Therefore we perform network propagation seeded with the community neighbors and performing enrichment on highly traversed portions of the graph.
library(hypeR)
genesets <- hypeR::msigdb_gsets("Homo sapiens", "H", clean=TRUE)
data <- enrich_community(ig, community="16", genesets, restart=0.5, plotting=TRUE)
par(mar=c(0,0,0,0))
ig.c <- data$ig
plot(ig.c,
     vertex.size=4,
     vertex.color=V(ig.c)$pcolor,
     vertex.label=NA,
     edge.width=1,
     layout=layout)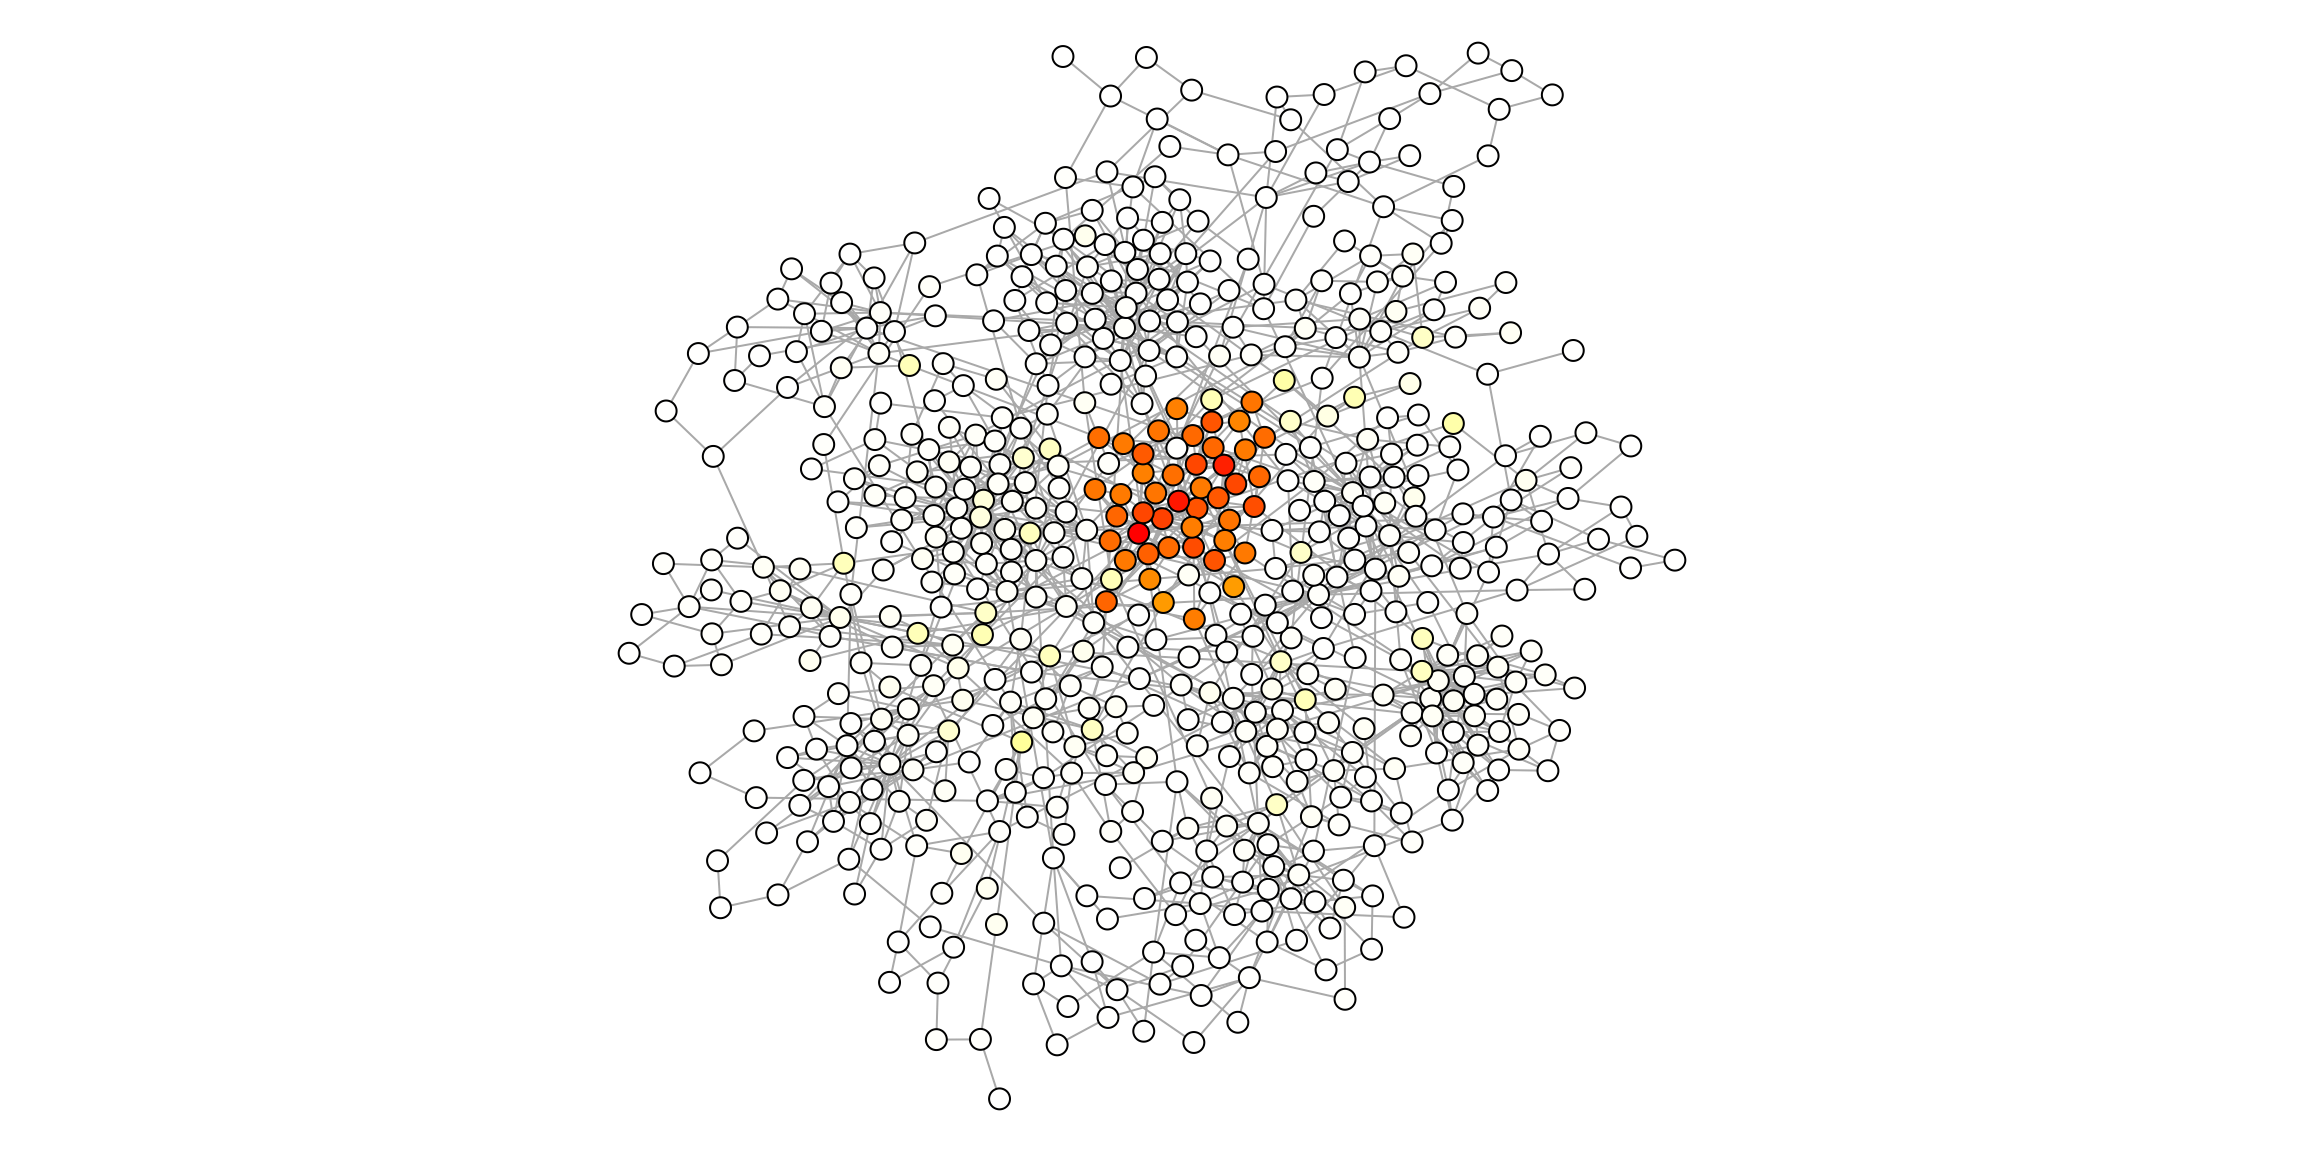
After traversing the network, we can define a ranked signature for this community - sort of like an extended signature - based on the most traversed nodes in the network.
head(igraph::as_data_frame(ig.c, what="vertices")) community color symbol name p pcolor
GMPS 8 #3E134F GMPS GMPS 2.745032e-05 #FFFFFE
PDLIM1 15 #9A9800 PDLIM1 PDLIM1 4.089194e-05 #FFFFFB
JUNB 15 #9A9800 JUNB JUNB 1.374812e-04 #FFFFF9
RER1 17 #50E2BB RER1 RER1 5.114133e-05 #FFFFFB
ICAM1 14 #A96C00 ICAM1 ICAM1 1.591791e-03 #FFFFC6
NPFFR2 14 #A96C00 NPFFR2 NPFFR2 2.941111e-05 #FFFFFE
signature.ranked <- V(ig.c)$p
names(signature.ranked) <- V(ig.c)$symbol
head(sort(signature.ranked, decreasing=TRUE))
EIF1B ELL NUDT21 ERCC5 SIAH1 SNAPC5
0.02916435 0.02722562 0.02642275 0.02362867 0.02315903 0.02314451 This happens implicitly within this function.
hyp.c <- data$hyp
hyp.c$plots$`Dna Repair`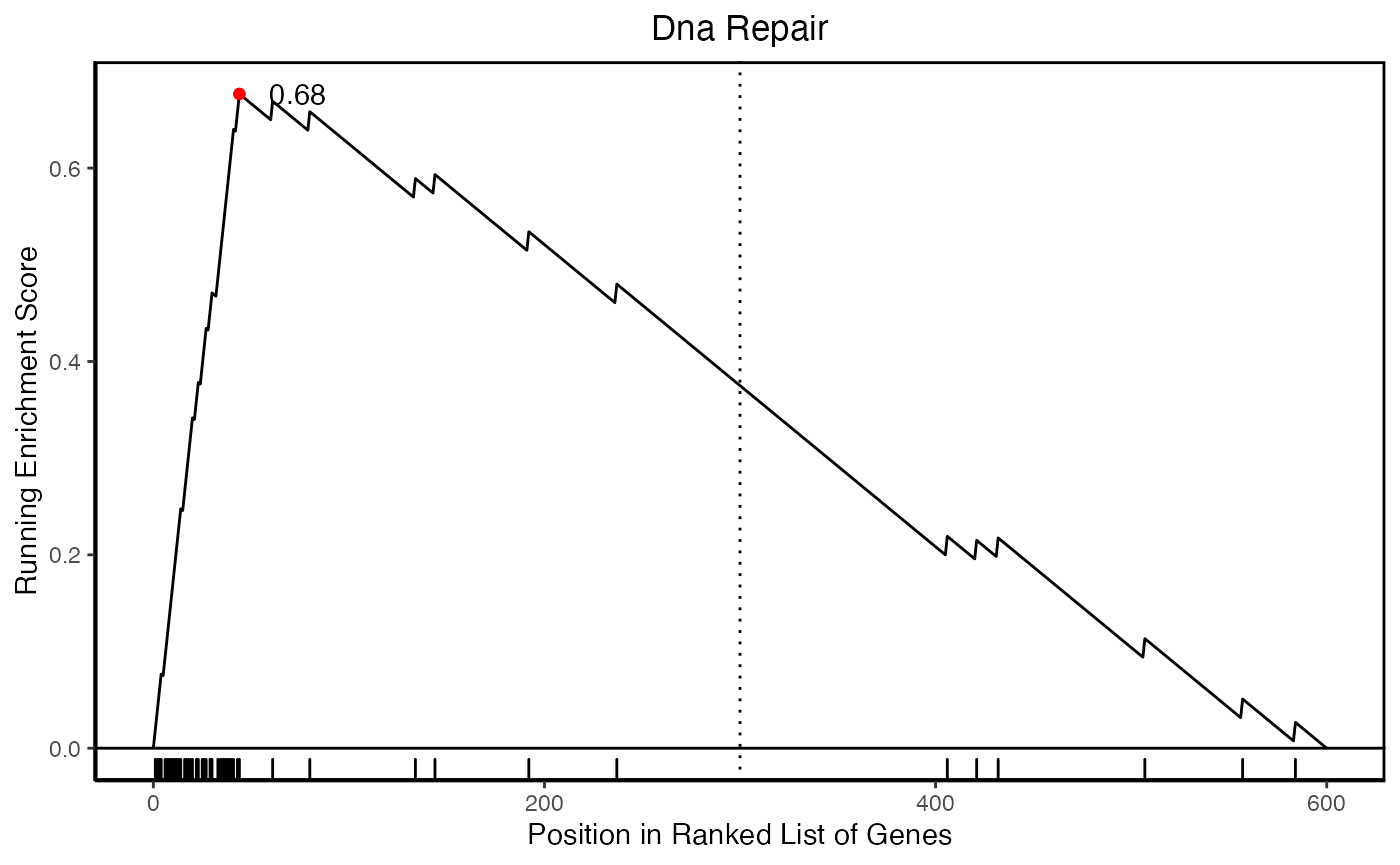
hypeR::hyp_dots(hyp.c)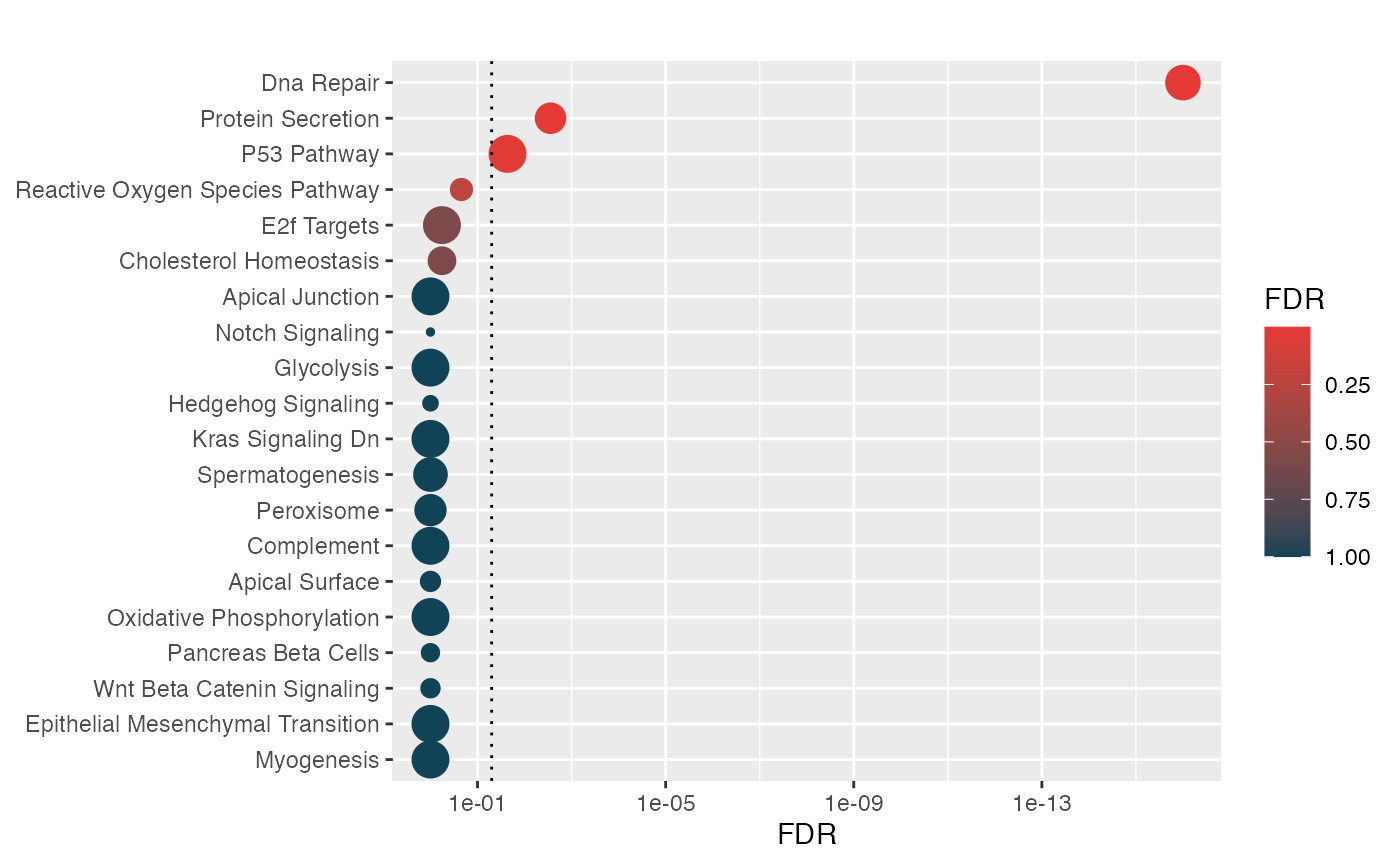
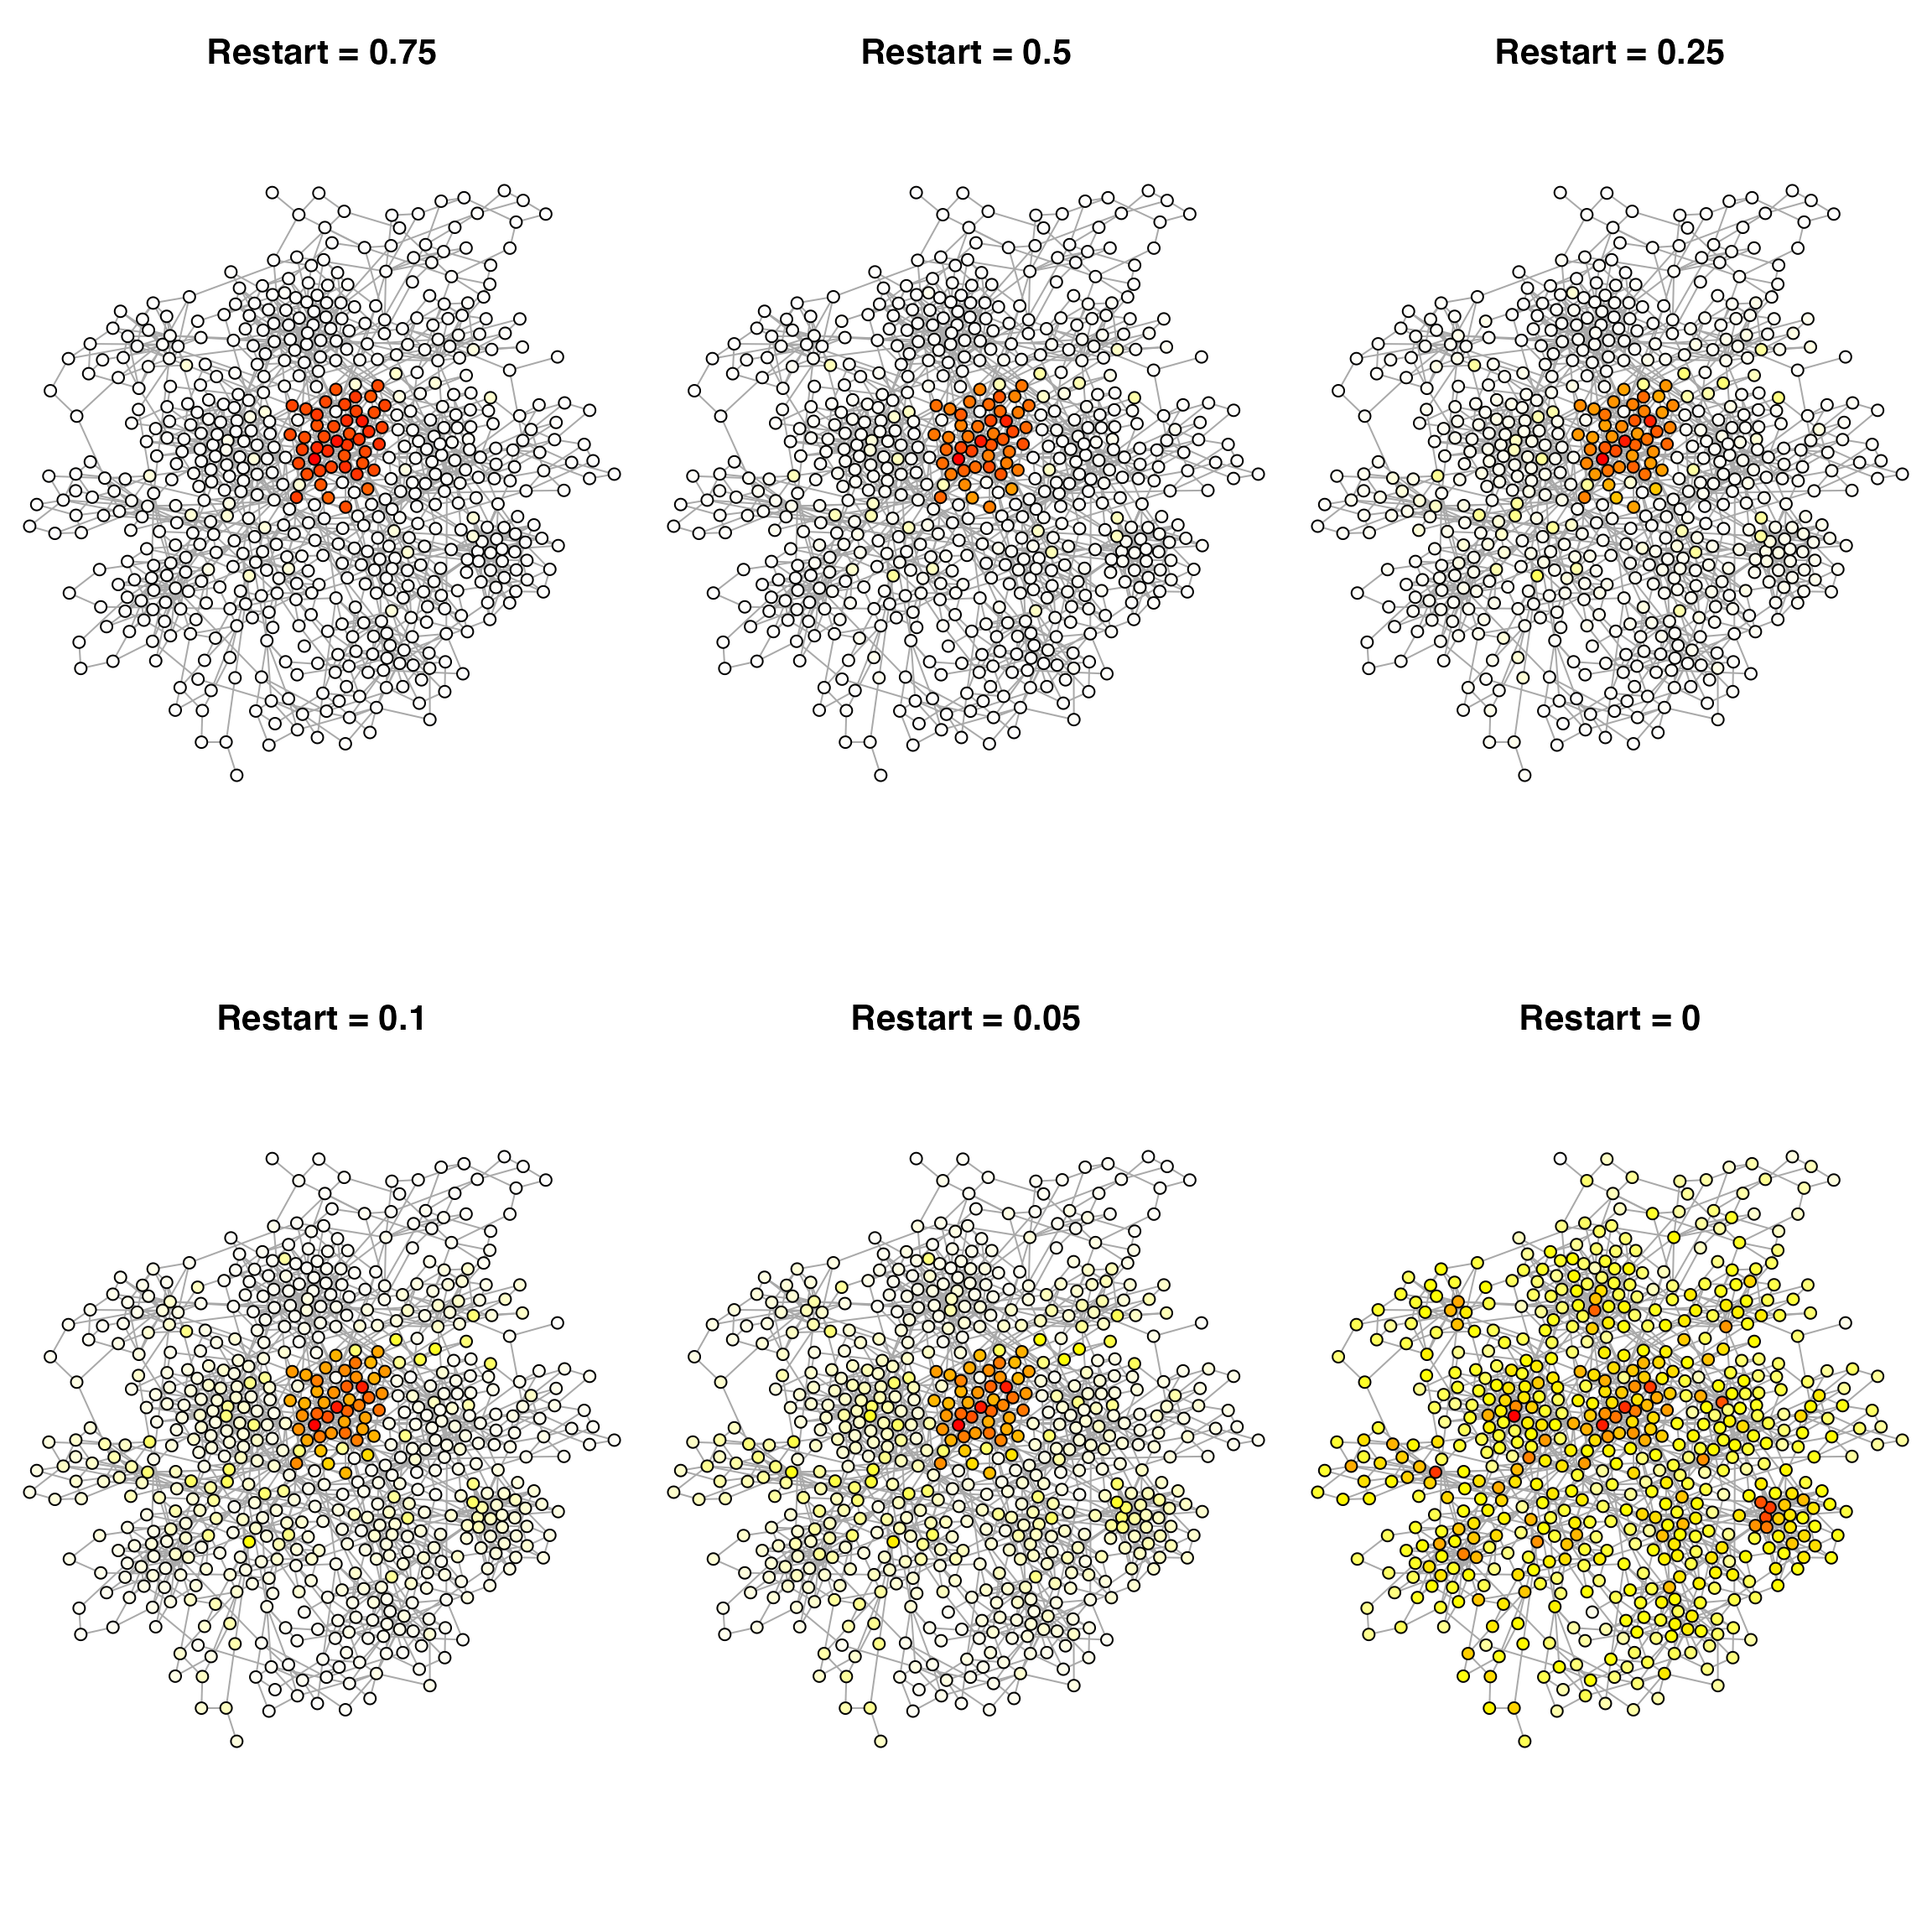
Restart probability
The most important parameter will be the restart probability of the random walks. This tells the algorithm how long the walks should be and is the probability of the random walk restarting from the community. In otherwords, this will define how fuzzy your extended signature for a given community will be.
par(mar=c(0,0,0,0), mfrow=c(2,3))
for (restart in c(0.75, 0.5, 0.25, 0.1, 0.05, 0)) {
    data <- enrich_community(ig, community="16", genesets, restart=restart)
    ig.c <- data$ig
    plot(ig.c,
         vertex.size=4,
         vertex.color=V(ig.c)$pcolor,
         vertex.label=NA,
         edge.width=1,
         layout=layout)
    title(paste0("Restart = ", restart), cex.main=2, font.main=2, line=-3)
}
Enrichment of a all communities
One way to visualize enrichment of the network would be to repeat the above process for each community
communities <- names(table(V(ig)$community))
lhyp <- mapply(function(community) {
    data <- enrich_community(ig, community=community, genesets, restart=0.5)
    return(data$hyp)
}, communities, SIMPLIFY=FALSE, USE.NAMES=FALSE)
names(lhyp) <- paste0("C", communities)

mhyp <- hypeR::multihyp$new(data=lhyp)
hypeR::hyp_dots(mhyp, merge=TRUE, top=50, fdr=0.01)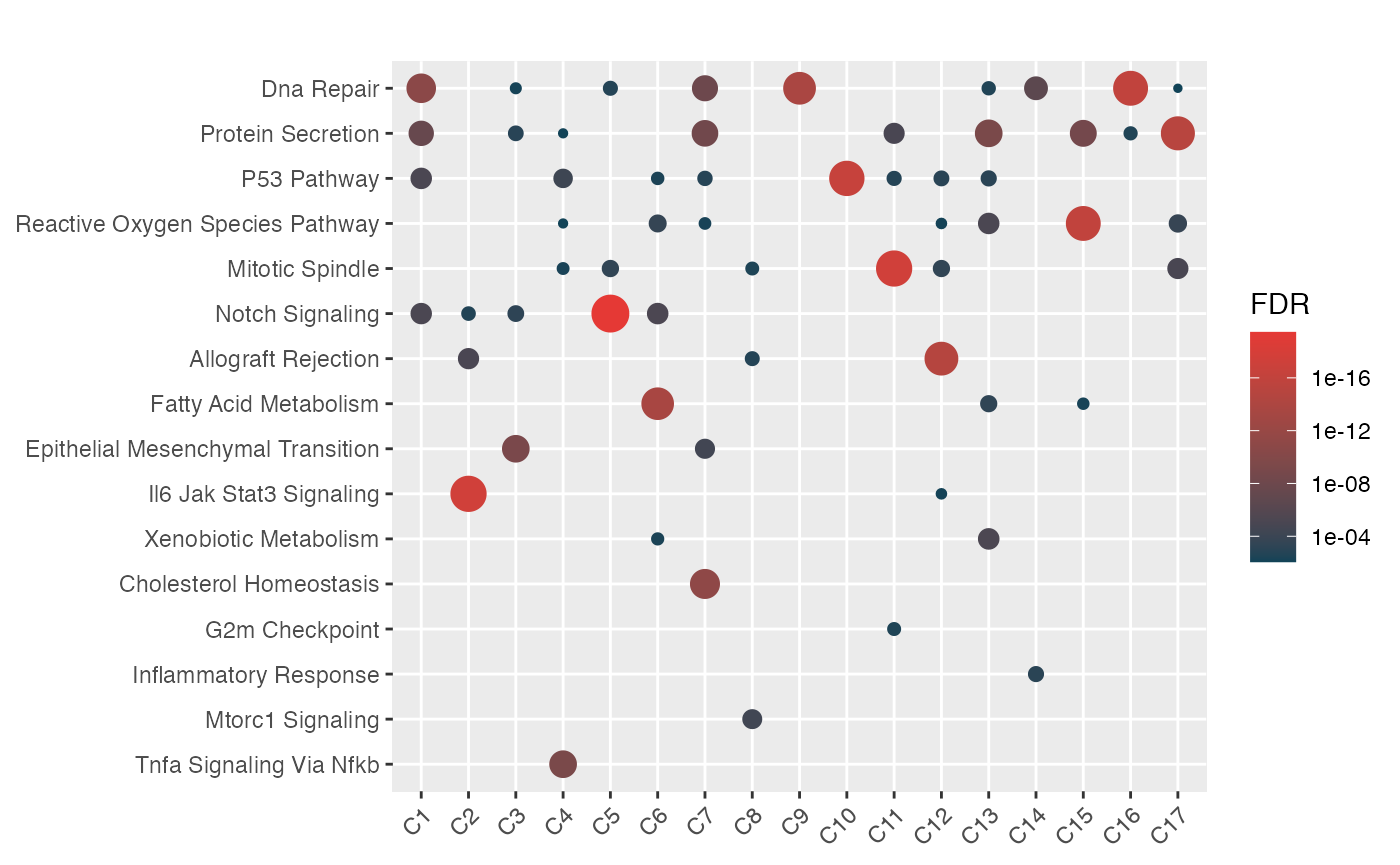
Although we can also visualize the enrichment on the graph itself, which will give some perspective on why some communities close to each other might be enriched for similar pathways.
ig.e <- enrich_communities_static(ig, genesets, restart=0.5, fdr=0.01, top=1)
par(mar=c(0,0,0,0))
set.seed(1234)
plot(ig.e,
     vertex.size=5,
     vertex.label=V(ig.e)$enrichment,
     vertex.color=adjustcolor(V(ig.e)$color, alpha.f=0.6),
     vertex.frame.color=adjustcolor("#000000", alpha.f=0),
     vertex.label.family="Helvetica",
     vertex.label.color="black",
     vertex.label.font=2,
     vertex.label.cex=0.8,
     vertex.label.dist=runif(vcount(ig.e), -0.25, 0.25),
     edge.color=adjustcolor("#000000", alpha.f=0.2),
     layout=layout)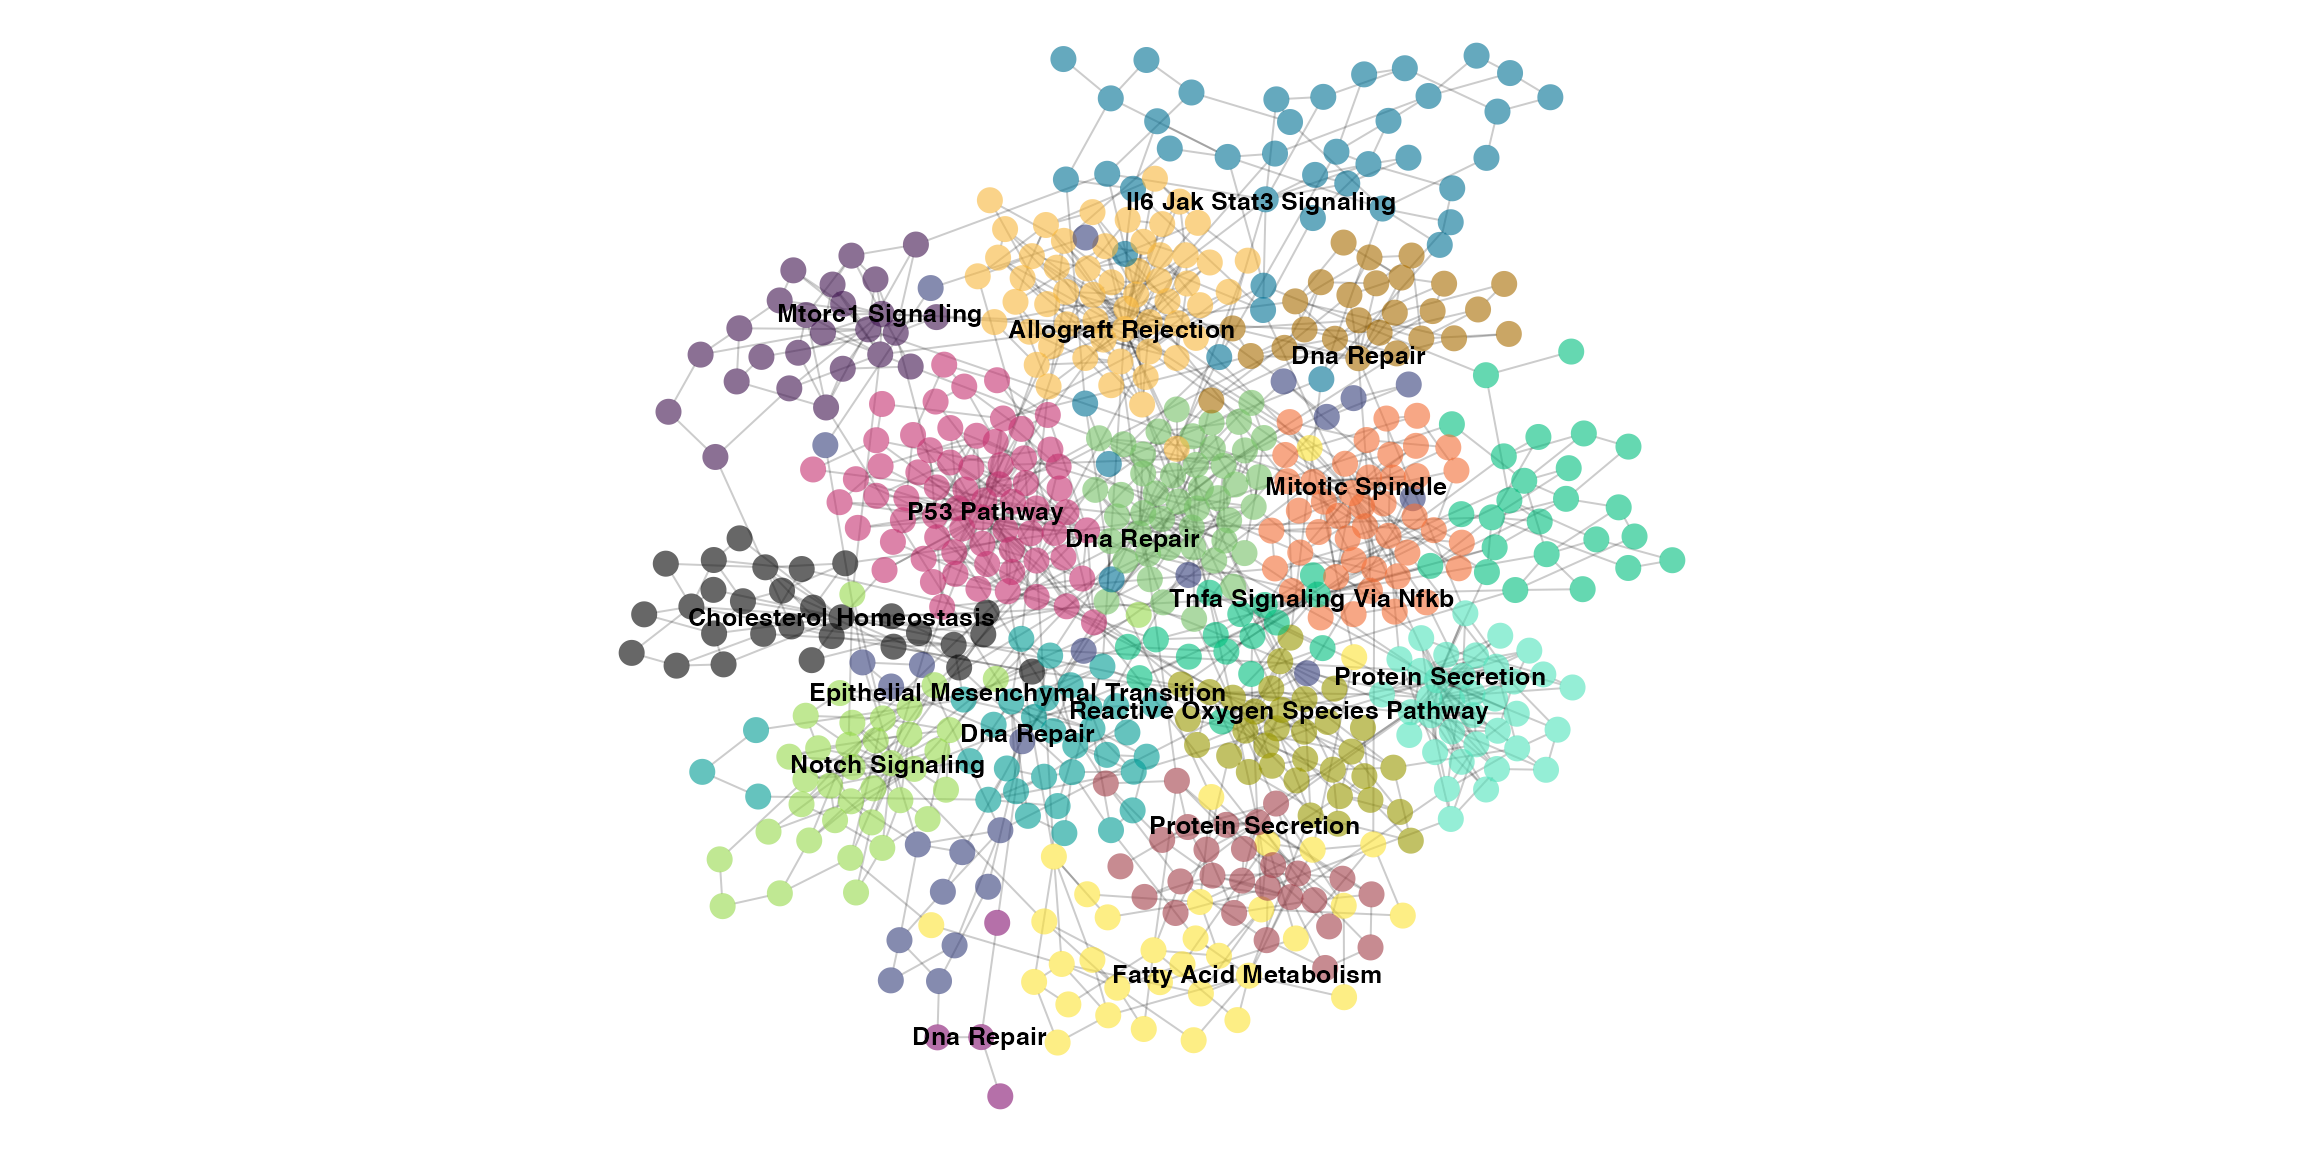
Interactive community enrichment
We have interactive versions of the same functionality that allows one to compactly fit more data into the network.
vn.e <- enrich_communities_interactive(ig, genesets, restart=0.5, fdr=0.25, top=3, val="fdr")Here you will get the original network but hovering over the nodes reveals community enrichment information.
visNetwork::visIgraphLayout(vn.e, layoutMatrix=layout)or
visNetwork::visIgraphLayout(vn.e, layout="layout_nicely", randomSeed=1)Meta interactive community enrichment
You can optionally create a low-dimensional meta-network of the communities with enrichment information where the edges between communities are weighted by the number of shared edges. We also set a minimum shared edge threshold to highlight communities with the largest overlap.
vn.e <- enrich_communities_interactive_meta(ig, genesets, restart=0.5, fdr=0.05, top=3, mse=3, val="fdr")
visNetwork::visIgraphLayout(vn.e, layout="layout_nicely", randomSeed=1)