Installation
- Using
devtoolspackage
library(devtools)
devtools::install_github("montilab/hypeR-GEM")
Usage
Here, we are using a dataset of coronavirus disease 2019 (COVID-19) metabolite signatures obtained from human urine samples.
(ii) Load metabolite signatures
The dataset is a list object containing two data frames:
up = up-regulated metabolites
dn = down-regulated metabolites
data(COVID_urine)
print(str(COVID_urine))
List of 2
 $ up:'data.frame': 161 obs. of  5 variables:
  ..$ metabolite    : chr [1:161] "(S)-a-amino-omega-caprolactam" "1,5-anhydroglucitol (1,5-AG)" "1-methyladenine" "1-methylguanine" ...
  ..$ refmet_name   : chr [1:161] "L-2-aminohexano-6-lactam" "1,5-Anhydrosorbitol" "1-Methyladenine" "1-Methylguanine" ...
  ..$ estimate      : chr [1:161] "0.29434017200000001" "2.5732795230000001" "0.71437854700000003" "1.168429911" ...
  ..$ P_value_adjust: num [1:161] 7.27e-03 1.93e-11 3.14e-02 1.29e-02 2.66e-02 ...
  ..$ gene_type     : chr [1:161] "up" "up" "up" "up" ...
 $ dn:'data.frame': 206 obs. of  5 variables:
  ..$ metabolite    : chr [1:206] "1,2,3-benzenetriol sulfate (1)" "1,3,7-trimethylurate" "1,7-dimethylurate" "1-methyl-5-imidazoleacetate" ...
  ..$ refmet_name   : chr [1:206] NA "1,3,7-Trimethyluric acid" "1,7-Dimethyluric acid" "1-Methyl-5-imidazoleacetic acid" ...
  ..$ estimate      : chr [1:206] "-2.9115951029999998" "-3.7085696989999999" "-3.6453960510000001" "-1.2098657509999999" ...
  ..$ P_value_adjust: num [1:206] 0.0258 0.049 0.0387 0.0483 0.0369 ...
  ..$ gene_type     : chr [1:206] "dn" "dn" "dn" "dn" ...
NULL
(iii) hypeR-GEM mapping
signature: A list of metabolic signatures. Each element must be a data frame containing a column whose name matches thereference_keyargument, , which specifies the RefMet annotation for each metabolite.-
directional: Logical argument specifying the metabolite–reaction mapping rule.- If
TRUE, metabolites are mapped only to reactions in which they appear as products (directional mapping). - If
FALSE, metabolites are mapped to reactions in which they appear as either reactants or products (non-directional mapping).
- If
promiscuous_threshold: Maximum allowable number of metabolites associated with a gene. Genes exceeding this threshold are classified as promiscuous and excluded from downstream analysis.background: Background used in the gene-specific hypergeometric test. By default, this is set to the total number of metabolites represented in the GEM.reference_key: A character string indicating the column name in each signature data frame that contains RefMet metabolite identifiers.
## Undirectional mapping
hypeR_GEM_obj <- hypeR.GEM::signature2gene(signatures = COVID_urine,
                                           directional = FALSE,
                                           promiscuous_threshold = 500,
                                           reference_key = 'refmet_name',
                                           background = NULL)


##Directional mapping
hypeR_GEM_obj_di <- hypeR.GEM::signature2gene(signatures = COVID_urine,
                                              directional = TRUE,
                                              promiscuous_threshold = 500,
                                              reference_key = 'refmet_name',
                                              background = NULL)
(iv) Enrichment analysis in the gene space
Here we use REACTOME genesets as an example.
data(reactome)Unweighted (standard) Hypergeometric test
The background we use in this analysis equals to all enzyme-coding genes in the Human GEM model (for more details, see here).
max_fdr <- 0.05
## Enrichment analysis from undirectional mapping
enrichment <- hypeR.GEM::enrichment(hypeR_GEM_obj,
genesets = reactome,
genesets_name = "REACTOME",
method='unweighted',
min_metabolite = 2,
background=3068)
## Enrichment analysis from undirectional mapping
enrichment_di <- hypeR.GEM::enrichment(hypeR_GEM_obj_di,
genesets = reactome,
genesets_name = "REACTOME",
method='unweighted',
min_metabolite = 2,
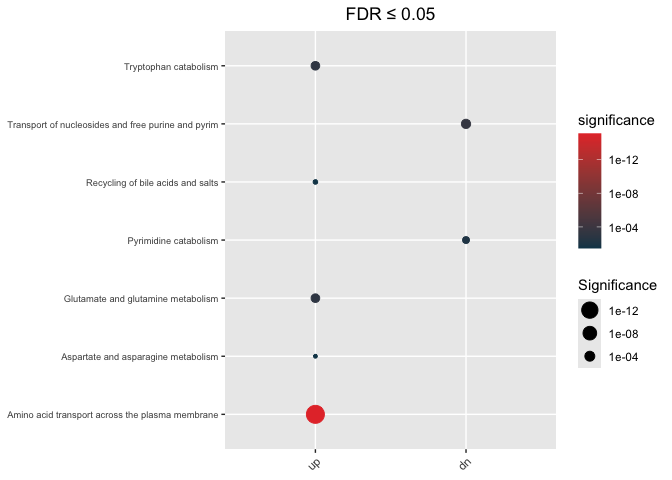
background=3068)Visualization of enrichment analysis
Undirectional
hypeR.GEM::enrichment_plot(enrichment,
                           top=40,
                           abrv=50,
                           size_by="significance",
                           fdr_cutoff= max_fdr,
                           val='fdr')+
  ggplot2::ggtitle(paste("FDR ≤", max_fdr)) +
  ggplot2::theme(axis.text.y = element_text(size = 7))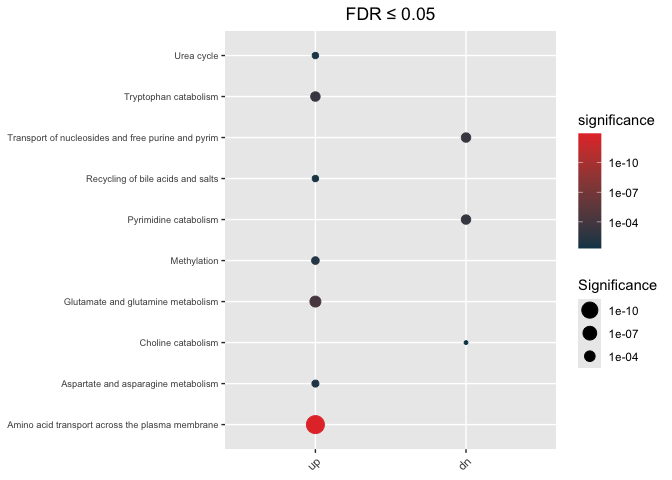
Directional
hypeR.GEM::enrichment_plot(enrichment_di,
                           top=40,
                           abrv=50,
                           size_by="significance",
                           fdr_cutoff= max_fdr,
                           val='fdr')+
  ggplot2::ggtitle(paste("FDR ≤", max_fdr)) +
  ggplot2::theme(axis.text.y = element_text(size = 7))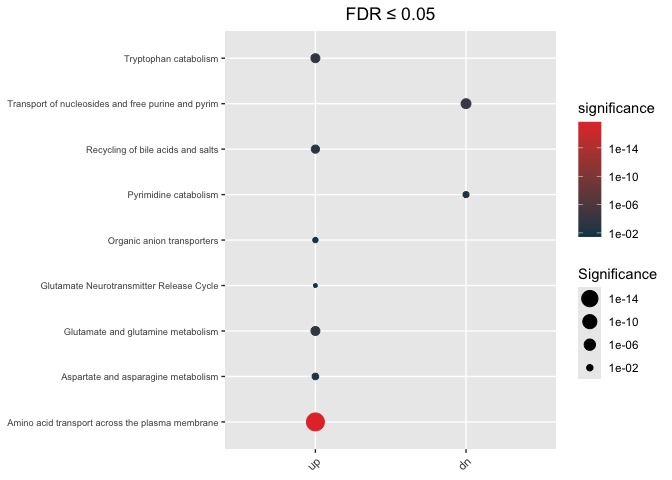
Weighted Hypergeometric test
max_fdr <- 0.05

## Enrichment analysis from undirectional mapping
enrichment_wt <- hypeR.GEM::enrichment(hypeR_GEM_obj,
                                       genesets = reactome,
                                       genesets_name = "REACTOME",
                                       method='weighted',
                                       weighted_by = 'fdr',
                                       sigmoid_transformation = TRUE,
                                       min_metabolite = 2,
                                       background=3068)

## Enrichment analysis from Directional mapping
enrichment_wt_di <- hypeR.GEM::enrichment(hypeR_GEM_obj_di,
                                          genesets = reactome,
                                          genesets_name = "REACTOME",
                                          method='weighted',
                                          weighted_by = 'fdr',
                                          sigmoid_transformation = TRUE,
                                          min_metabolite = 2,
                                          background=3068)
Visualization of enrichment analysis
Undirectional
hypeR.GEM::enrichment_plot(enrichment_wt,
                           top=40,
                           abrv=50,
                           size_by="significance",
                           fdr_cutoff= max_fdr,
                           val='fdr')+
  ggplot2::ggtitle(paste("FDR ≤", max_fdr)) +
  ggplot2::theme(axis.text.y = element_text(size = 7))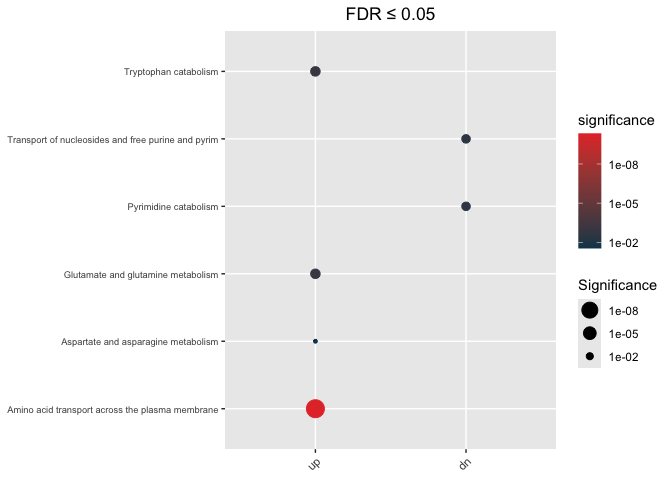
Directional
hypeR.GEM::enrichment_plot(enrichment_wt_di,
                           top=40,
                           abrv=50,
                           size_by="significance",
                           fdr_cutoff= max_fdr,
                           val='fdr')+
  ggplot2::ggtitle(paste("FDR ≤", max_fdr)) +
  ggplot2::theme(axis.text.y = element_text(size = 7))