Plot signature similarity heatmaps
Source:R/signature_similarity_heatmap.R
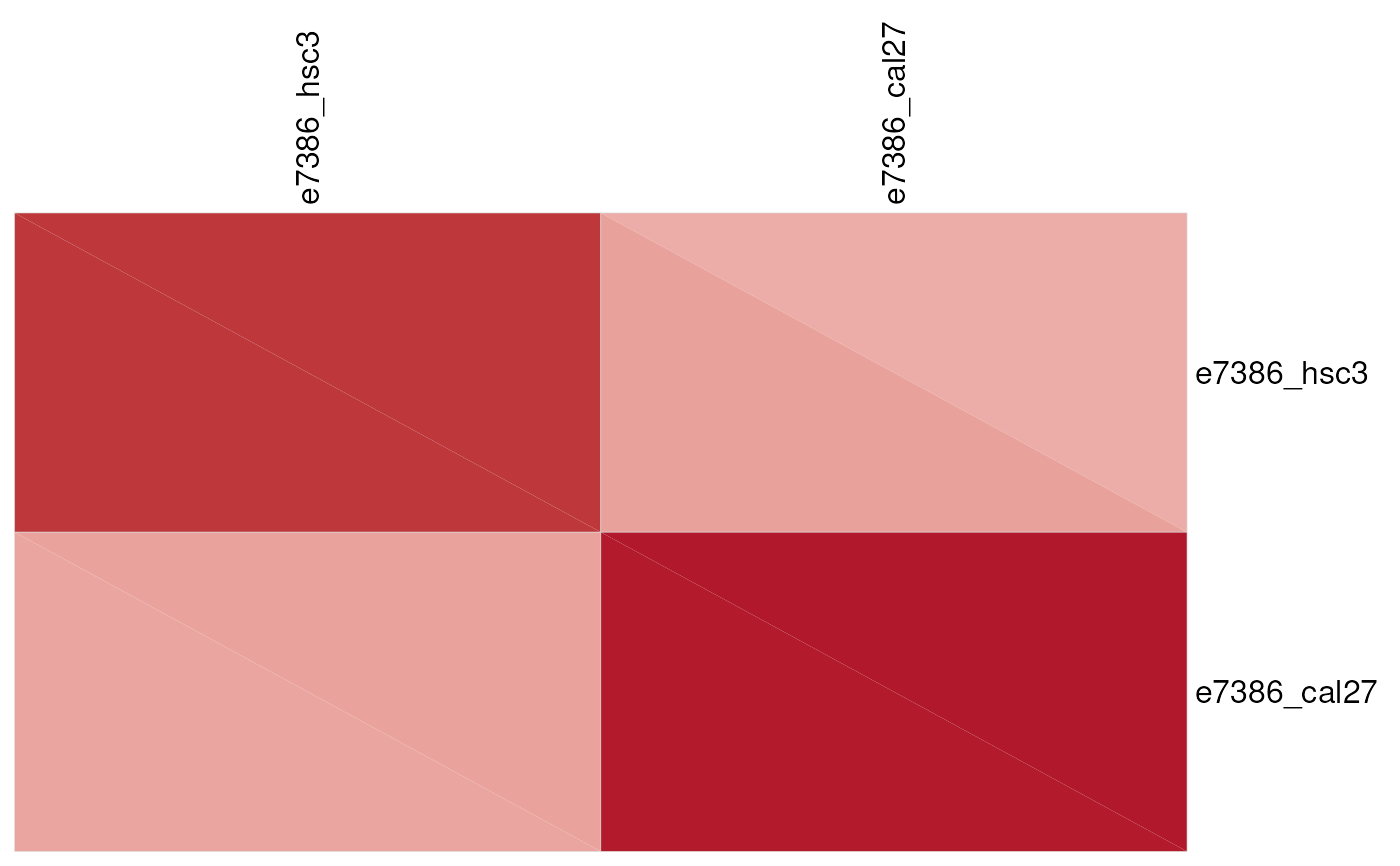
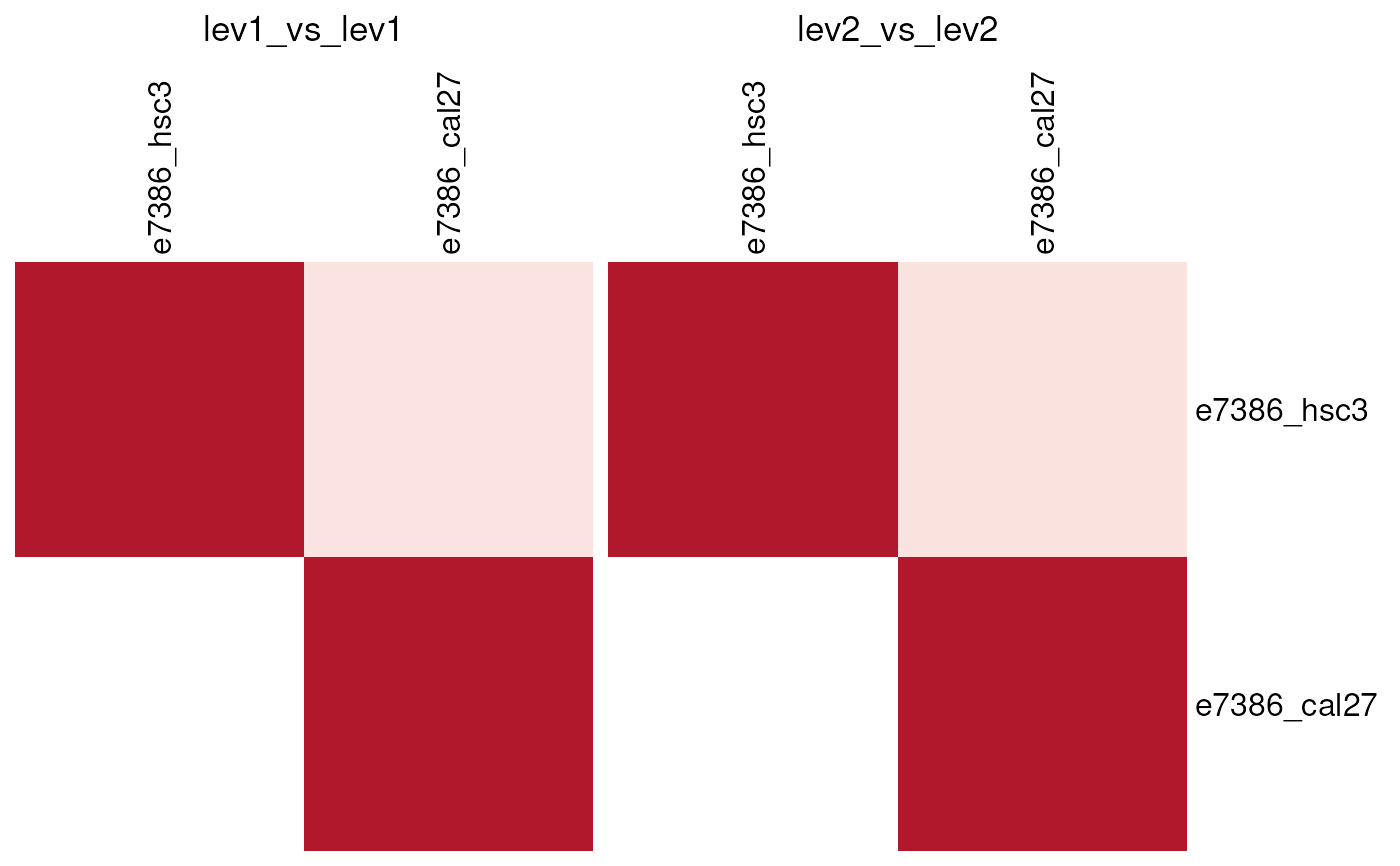
signature_similarity_heatmap.RdPlot one or more ComplexHeatmap heatmaps from the object returned by `compare_omic_signatures()`. Overlap comparisons can show Jaccard similarity or p-value-based similarity on a `-log10(p-value)` scale. Asymmetric KS and GSEA comparisons can show score or `-log10(p-value)` matrices. For both, `mode = "combined"` draws split cells: the top-right triangle shows `level2_vs_level2` and the bottom-left triangle shows `level1_vs_level1`. `mode = "separate"` draws one full heatmap per level, each panel titled with an abbreviated label such as `"lev1_vs_lev1"`; since both panels use the same color scale, they share a single combined legend rather than showing two identical ones. `mode = "split"` is invalid for rank-based comparisons.
Usage
signature_similarity_heatmap(
  comparison,
  measure = c("jaccard", "score", "pvalue"),
  mode = c("separate", "combined", "split"),
  annotation = NULL,
  annotation_side = c("column", "row"),
  triangle = c("upper", "lower"),
  cluster_method = "ward.D",
  col_fun = NULL,
  pos_col_fun = NULL,
  neg_col_fun = NULL,
  combined_triangle_threshold = 50,
  na_style = c("grey", "hatch"),
  draw = TRUE,
  ...
)
Arguments
- comparison
Output from `compare_omic_signatures()`.
- measure
One of `"jaccard"`, `"score"`, or `"pvalue"`.
- mode
One of `"separate"`, `"combined"`, or `"split"`.
- annotation
Optional ComplexHeatmap::HeatmapAnnotation object.
- annotation_side
Where to place annotation: `"column"` or `"row"`.
- triangle
Triangle to display for symmetric overlap heatmaps in `"separate"` and `"combined"` modes.
- cluster_method
Hierarchical clustering method passed to hclust or cba.
- col_fun
Color function for separate heatmaps.
- pos_col_fun
Color function for first-level triangles in combined mode.
- neg_col_fun
Color function for second-level triangles in combined mode.
- combined_triangle_threshold
Maximum matrix size for split triangles inside each cell in combined mode.
- na_style
How to render cells that could not be computed (currently only possible for rank-based comparisons, when a `sig_list2` signature has no difexp table and so cannot serve as the ranking side): `"grey"` fills the cell with a solid grey, `"hatch"` fills it with a diagonal hatch pattern. This does not affect the redundant (hidden) half of a symmetric self-comparison matrix, which always stays fully transparent.
- draw
Logical; draw the heatmap before returning it.
- ...
Additional arguments passed to ComplexHeatmap::Heatmap().
Examples
data(compare_signatures_example)
overlap_res <- compare_omic_signatures(
compare_signatures_example[1:2],
method = "overlap",
score_cutoff = log2(1.025),
adj_p_cutoff = 0.01,
min_features = 10
)
if (requireNamespace("ComplexHeatmap", quietly = TRUE) &&
requireNamespace("circlize", quietly = TRUE)) {
signature_similarity_heatmap(overlap_res, draw = FALSE)
}
 ks_res <- compare_omic_signatures(
compare_signatures_example[1:2],
method = "ks_rank",
adj_p_cutoff = 0.01,
min_features = 10
)
if (requireNamespace("ComplexHeatmap", quietly = TRUE) &&
requireNamespace("circlize", quietly = TRUE)) {
signature_similarity_heatmap(
ks_res,
measure = "score",
mode = "combined",
draw = FALSE
)
}
ks_res <- compare_omic_signatures(
compare_signatures_example[1:2],
method = "ks_rank",
adj_p_cutoff = 0.01,
min_features = 10
)
if (requireNamespace("ComplexHeatmap", quietly = TRUE) &&
requireNamespace("circlize", quietly = TRUE)) {
signature_similarity_heatmap(
ks_res,
measure = "score",
mode = "combined",
draw = FALSE
)
}