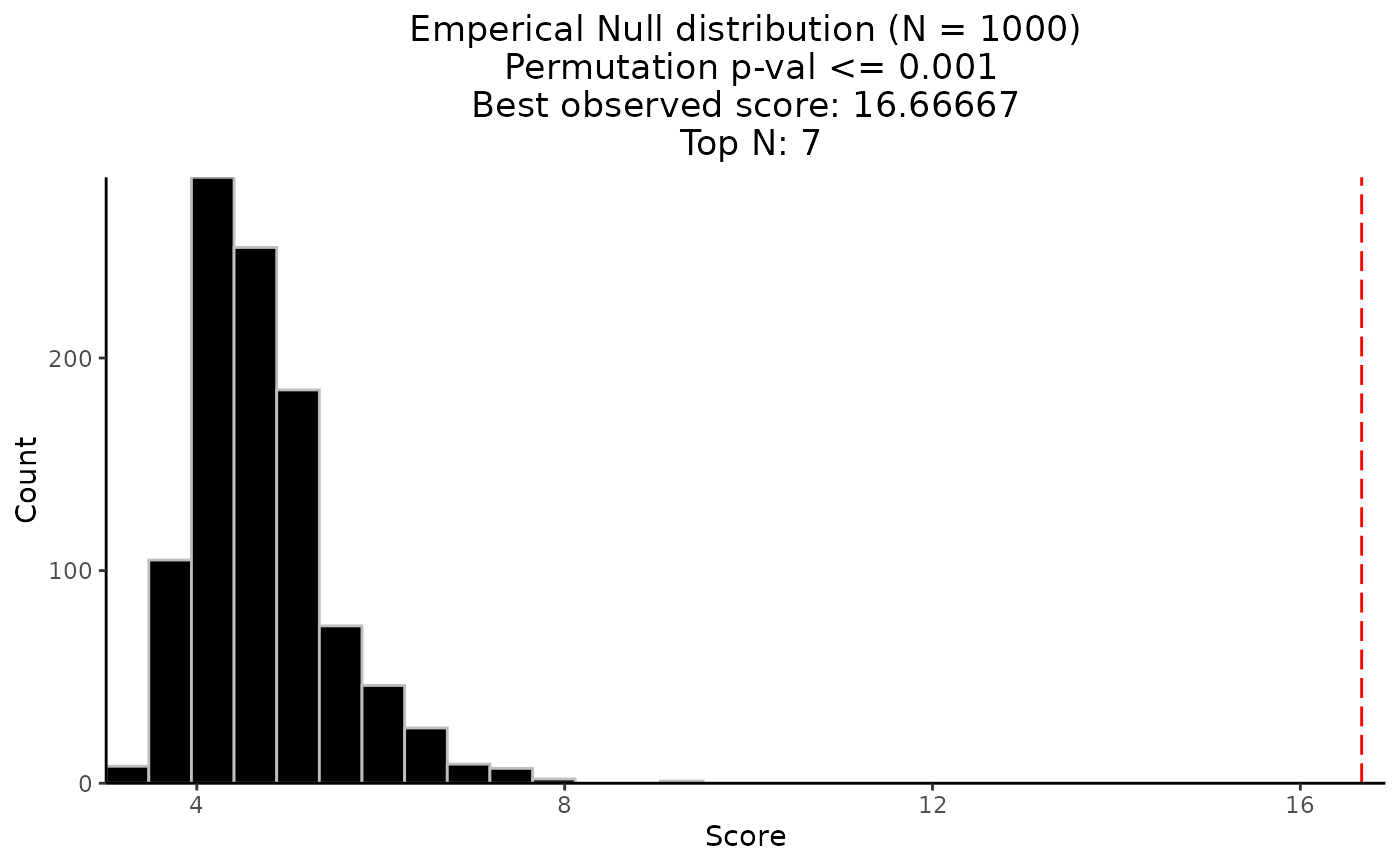
Plot the Empirical Null Distribution of Permutation Best Scores returned from
CaDrA function
permutation_plot(perm_res)Arguments
Value
a density plot
Examples
# Load pre-computed permutation results
data(perm_res)

# Plot the permutation results
permutation_plot(perm_res)
#> `stat_bin()` using `bins = 30`. Pick better value `binwidth`.