![]()


Candidate Drivers Analysis: Multi-Omic Search for Candidate Drivers of Functional Signatures
CaDrA is an R package that supports a heuristic search framework aimed at identifying candidate drivers of a molecular phenotype of interest.
The main function takes two inputs:
- A binary multi-omics dataset, which can be represented as a matrix of binary features or a SummarizedExperiment class object where the rows are 1/0 vectors indicating the presence/absence of ‘omics’ features (e.g. somatic mutations, copy number alterations, epigenetic marks, etc.), and the columns are the samples.
- A molecular phenotype of interest which can be represented as a vector of continuous scores (e.g. protein expression, pathway activity, etc.)
Based on these two inputs, CaDrA implements a forward and/or backward search algorithm to find a set of features that together is maximally associated with the observed input scores, based on one of several scoring functions (Kolmogorov-Smirnov, Wilcoxon, Conditional Mutual Information, K-Nearest Neighbor Mutual Information Estimator, correlation, or custom-defined scoring function), making it useful to find complementary omics features likely driving the input molecular phenotype.
Please see our documentation for additional examples.
Web Interface
We developed an R Shiny Dashboard that would allow users to interact with CaDrA directly without the need to install or maintain the package.
See our web portal at https://cadra.bu.edu/
Usage
Here, we are using a dataset of somatic mutations and CNAs extracted from the TCGA Breast Cancer Dataset. We will query this Feature Set based on an Input Score that measures the per-sample activity of YAP/TAZ (two important regulators of the hippo pathway). This score represents the projection on the TCGA BrCa dataset of a gene expression signature of YAP/TAZ knockdown derived in breast cancer cell lines. Our question of interest: what is the combination of genetic features (mutations and copy number alterations) that best “explain” the YAP/TAZ activity?
(ii) Format and filter data inputs
## Read in BRCA GISTIC+Mutation object
utils::data(BRCA_GISTIC_MUT_SIG)
eset_mut_scna <- BRCA_GISTIC_MUT_SIG

## Read in input score
utils::data(TAZYAP_BRCA_ACTIVITY)
input_score <- TAZYAP_BRCA_ACTIVITY

## Samples to keep based on the overlap between the two inputs
overlap <- base::intersect(base::names(input_score), base::colnames(eset_mut_scna))
eset_mut_scna <- eset_mut_scna[, overlap]
input_score <- input_score[overlap]

## Binarize FS to only have 0's and 1's
SummarizedExperiment::assay(eset_mut_scna)[SummarizedExperiment::assay(eset_mut_scna) > 1] <- 1.0

## Pre-filter FS based on occurrence frequency
eset_mut_scna_flt <- CaDrA::prefilter_data(
  FS = eset_mut_scna,
  max_cutoff = 0.6,  # max event frequency (60%)
  min_cutoff = 0.03  # min event frequency (3%)
)
(iii) Run CaDrA
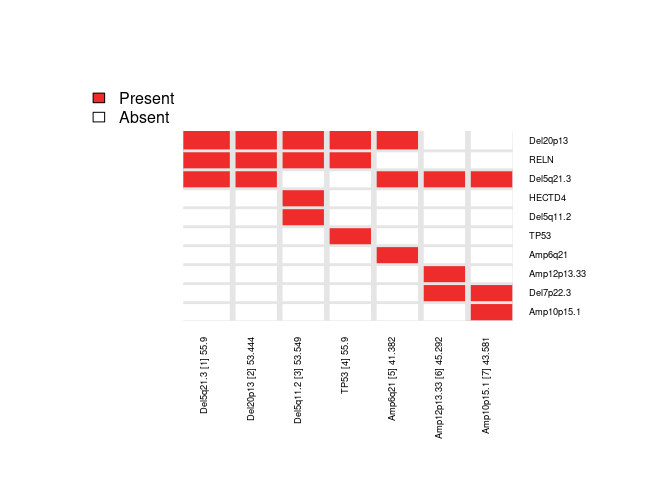
Here, we repeat the candidate search starting from each of the top ‘N’ features and report the combined results as a heatmap (to summarize the number of times each feature is selected across repeated runs).
IMPORTANT NOTE: The legacy function topn_eval() is equivalent to the new recommended candidate_search() function.
topn_res <- CaDrA::candidate_search(
  FS = eset_mut_scna_flt,
  input_score = input_score,
  method = "ks_pval",          # Use Kolmogorow-Smirnow scoring function
  method_alternative = "less", # Use one-sided hypothesis testing
  weights = NULL,              # If weights is provided, perform a weighted-KS test
  search_method = "both",      # Apply both forward and backward search
  top_N = 7,                   # Evaluate top 7 starting points for each search
  max_size = 7,                # Maximum size a meta-feature matrix can extend to
  do_plot = FALSE,             # Plot after finding the best features
  best_score_only = FALSE      # Return all results from the search
)
(iv) Visualize the results
Meta-feature plot
This plot produces 3 graphics stacked on top of each other:
- A density diagram of observed input scores sorted from highest to lowest
- A tile plot for the top meta-features that associated with a molecular phenotype of interest (e.g. input_score)
- A KS enrichment plot of the meta-feature set (this correspond to the logical OR of the features)
## Fetch the meta-feature set corresponding to its best scores over top N features searches
topn_best_meta <- CaDrA::topn_best(topn_res)

# Visualize the best results with the meta-feature plot
CaDrA::meta_plot(topn_best_list = topn_best_meta, input_score_label = "YAP/TAZ Activity")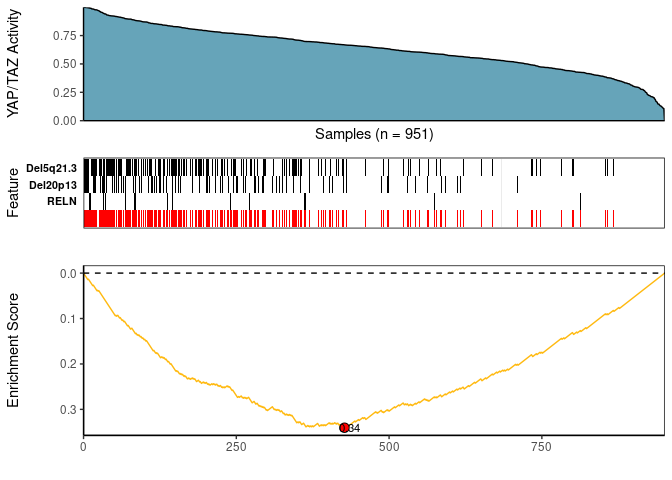
Acknowledgements
This project is funded in part by the NIH/NIDCR (3R01DE030350-01A1S1, R01DE031831), Find the Cause Breast Cancer Foundation, and NIH/NIA (UH3 AG064704).