4. Navigating the K2Taxonomer Dashboard
Eric R. Reed
Boston University School of Medicine, Section of Computational Biomedicine, 72 E Concord St, Boston, MA 02118reeder@bu.edu
November 2, 2020
Source:vignettes/K2Taxonomer_dashhelp.Rmd
K2Taxonomer_dashhelp.RmdIntroduction
To facilitate the comprehensive interrogation the output of K2Taxonomer this package includes functionality for generating interactive dashboards, which include full compendia of results (Reed and Monti 2020). In addition to the partition-level molecular comparisons included in these dashboards, they include functionality for performing molecular comparisons of gene expression and gene set enrichment on user-specified sets of two-or-more subgroups. Here we describe the layout and usage of these dashboards.
For more information for how to generate these dashboards go here.
The K2Taxonomer dashboards include three tabs, described below:
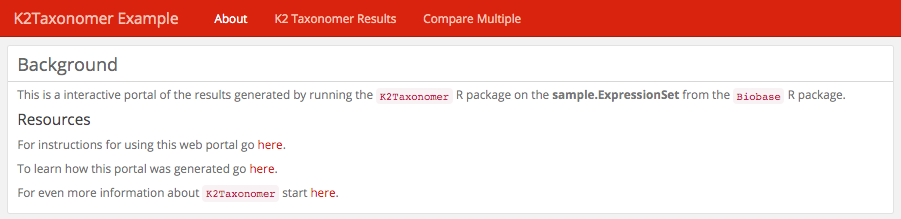
About: This is an optional tab with which the user can include information about the analysis being performed. This page is populated by a file, “about.md”, included in the same directory as the dashboard file. More information about formatting this file can be found here.
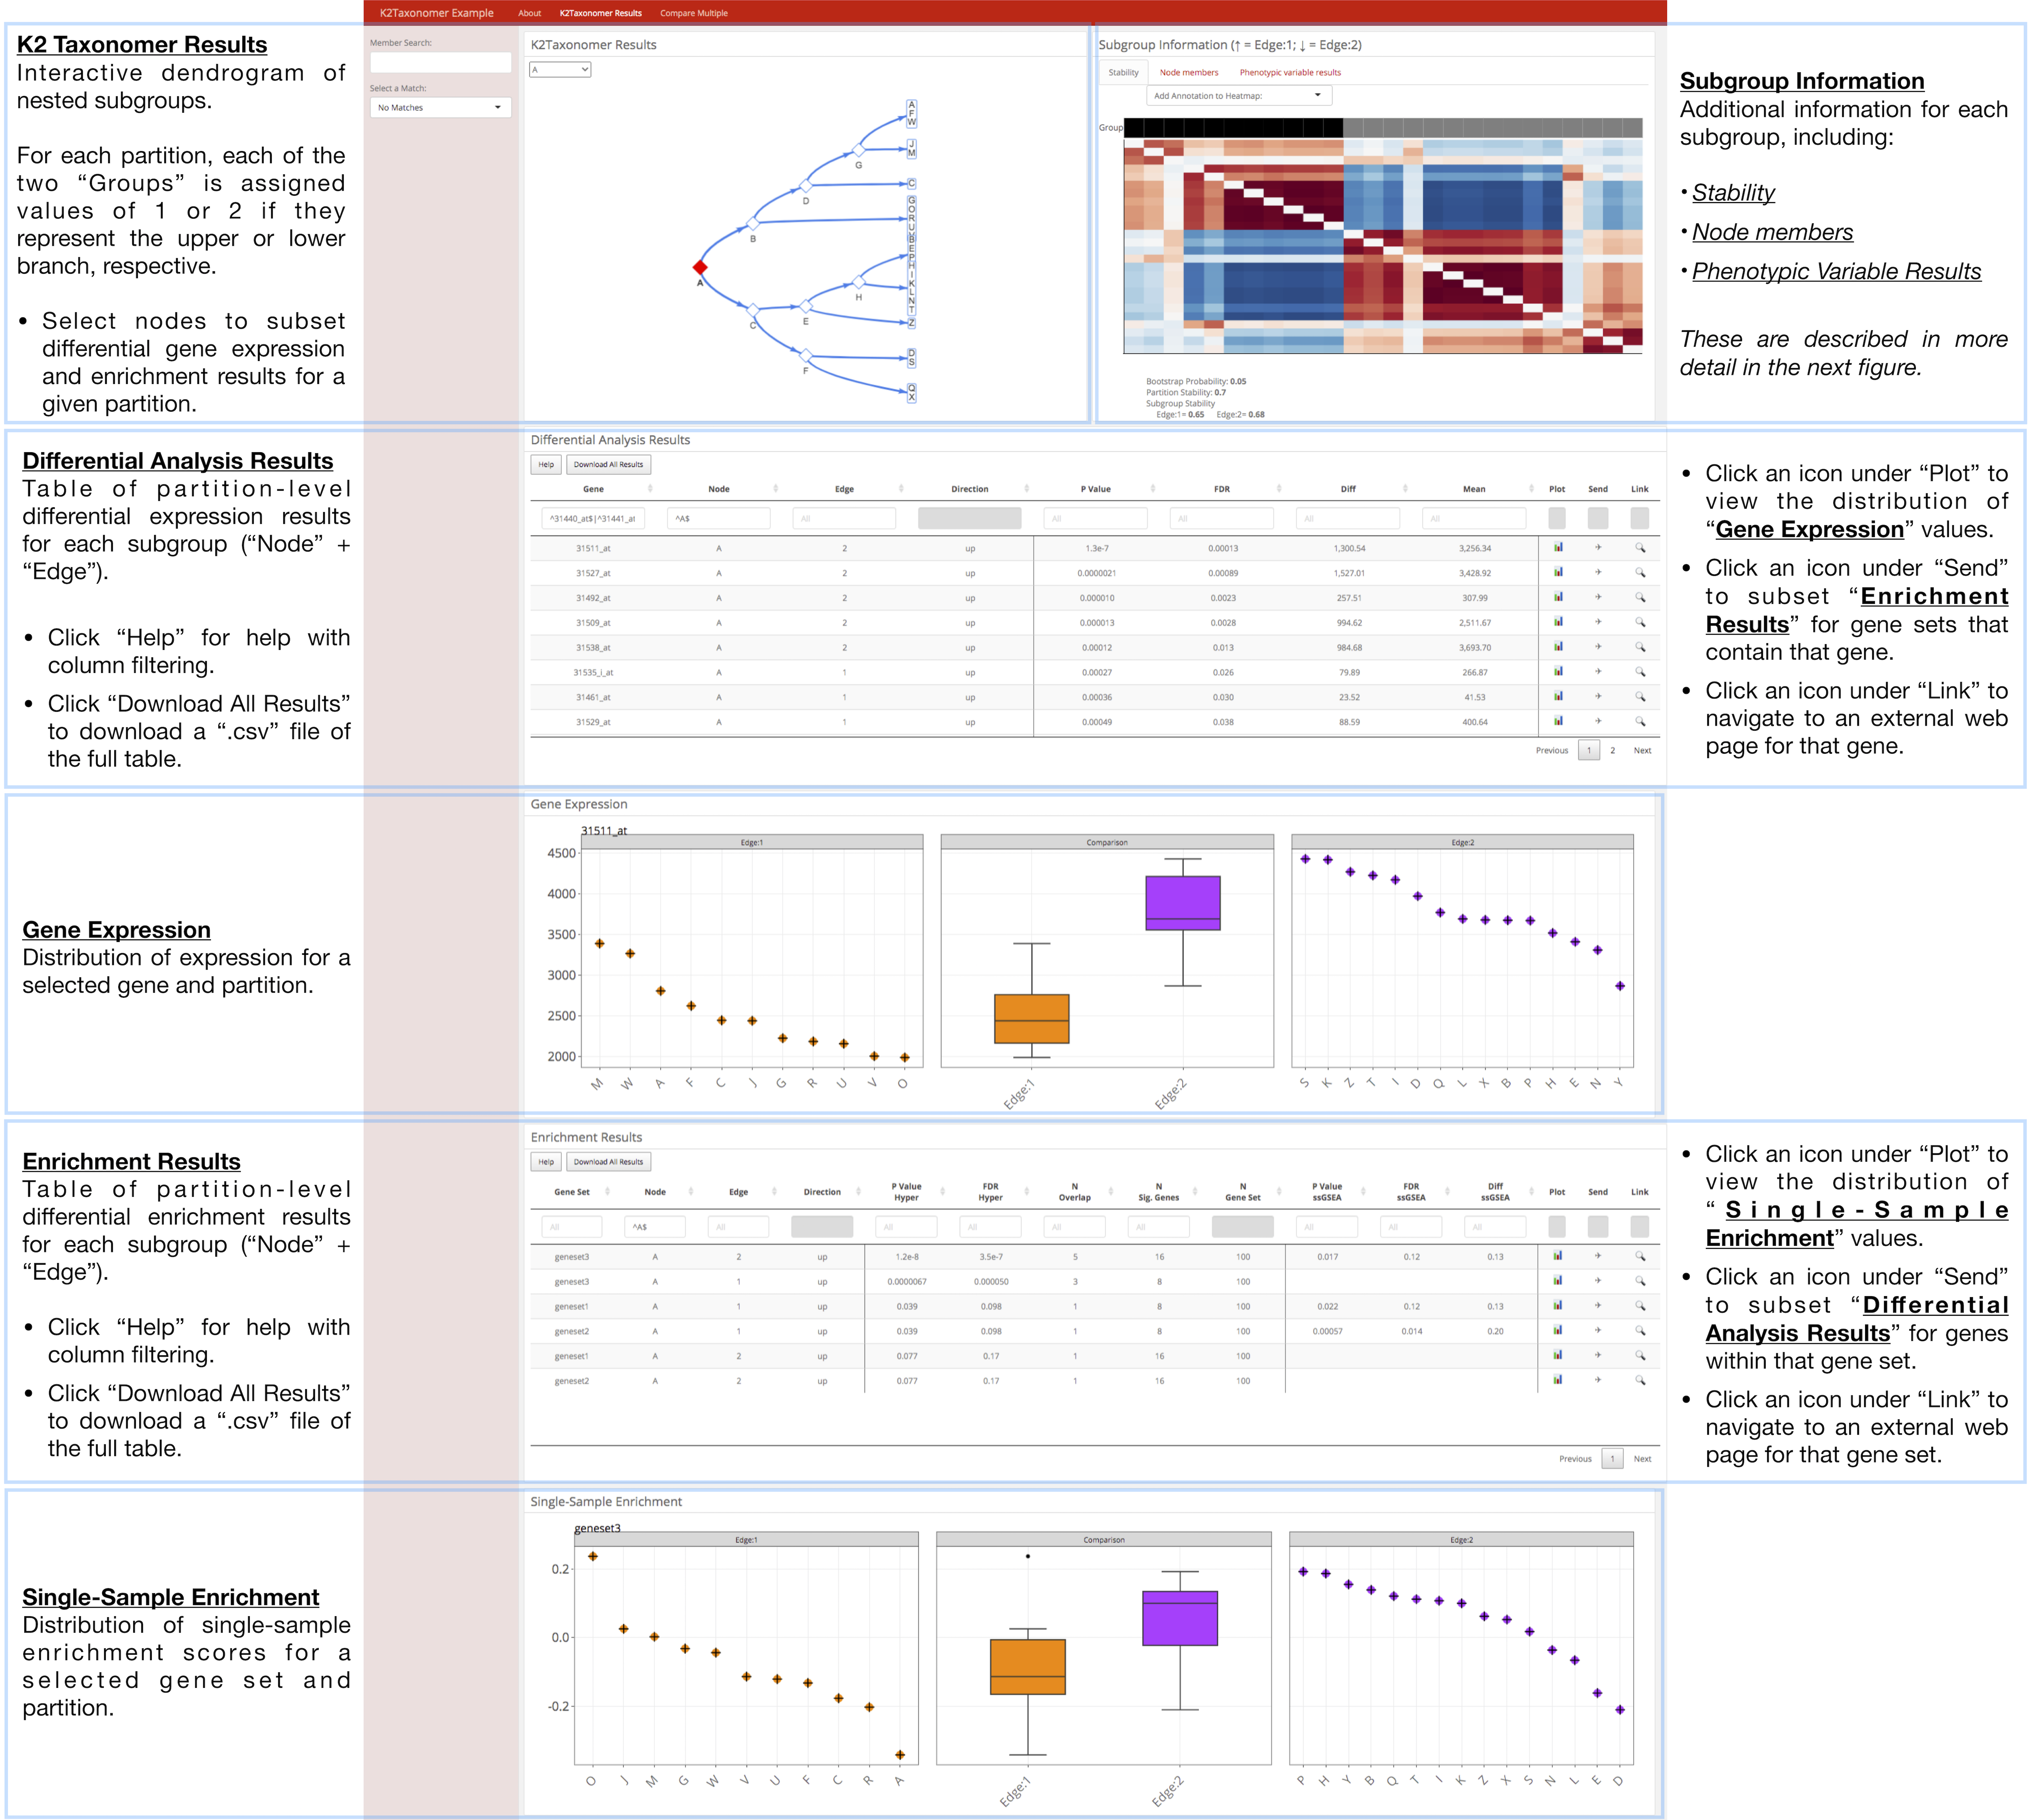
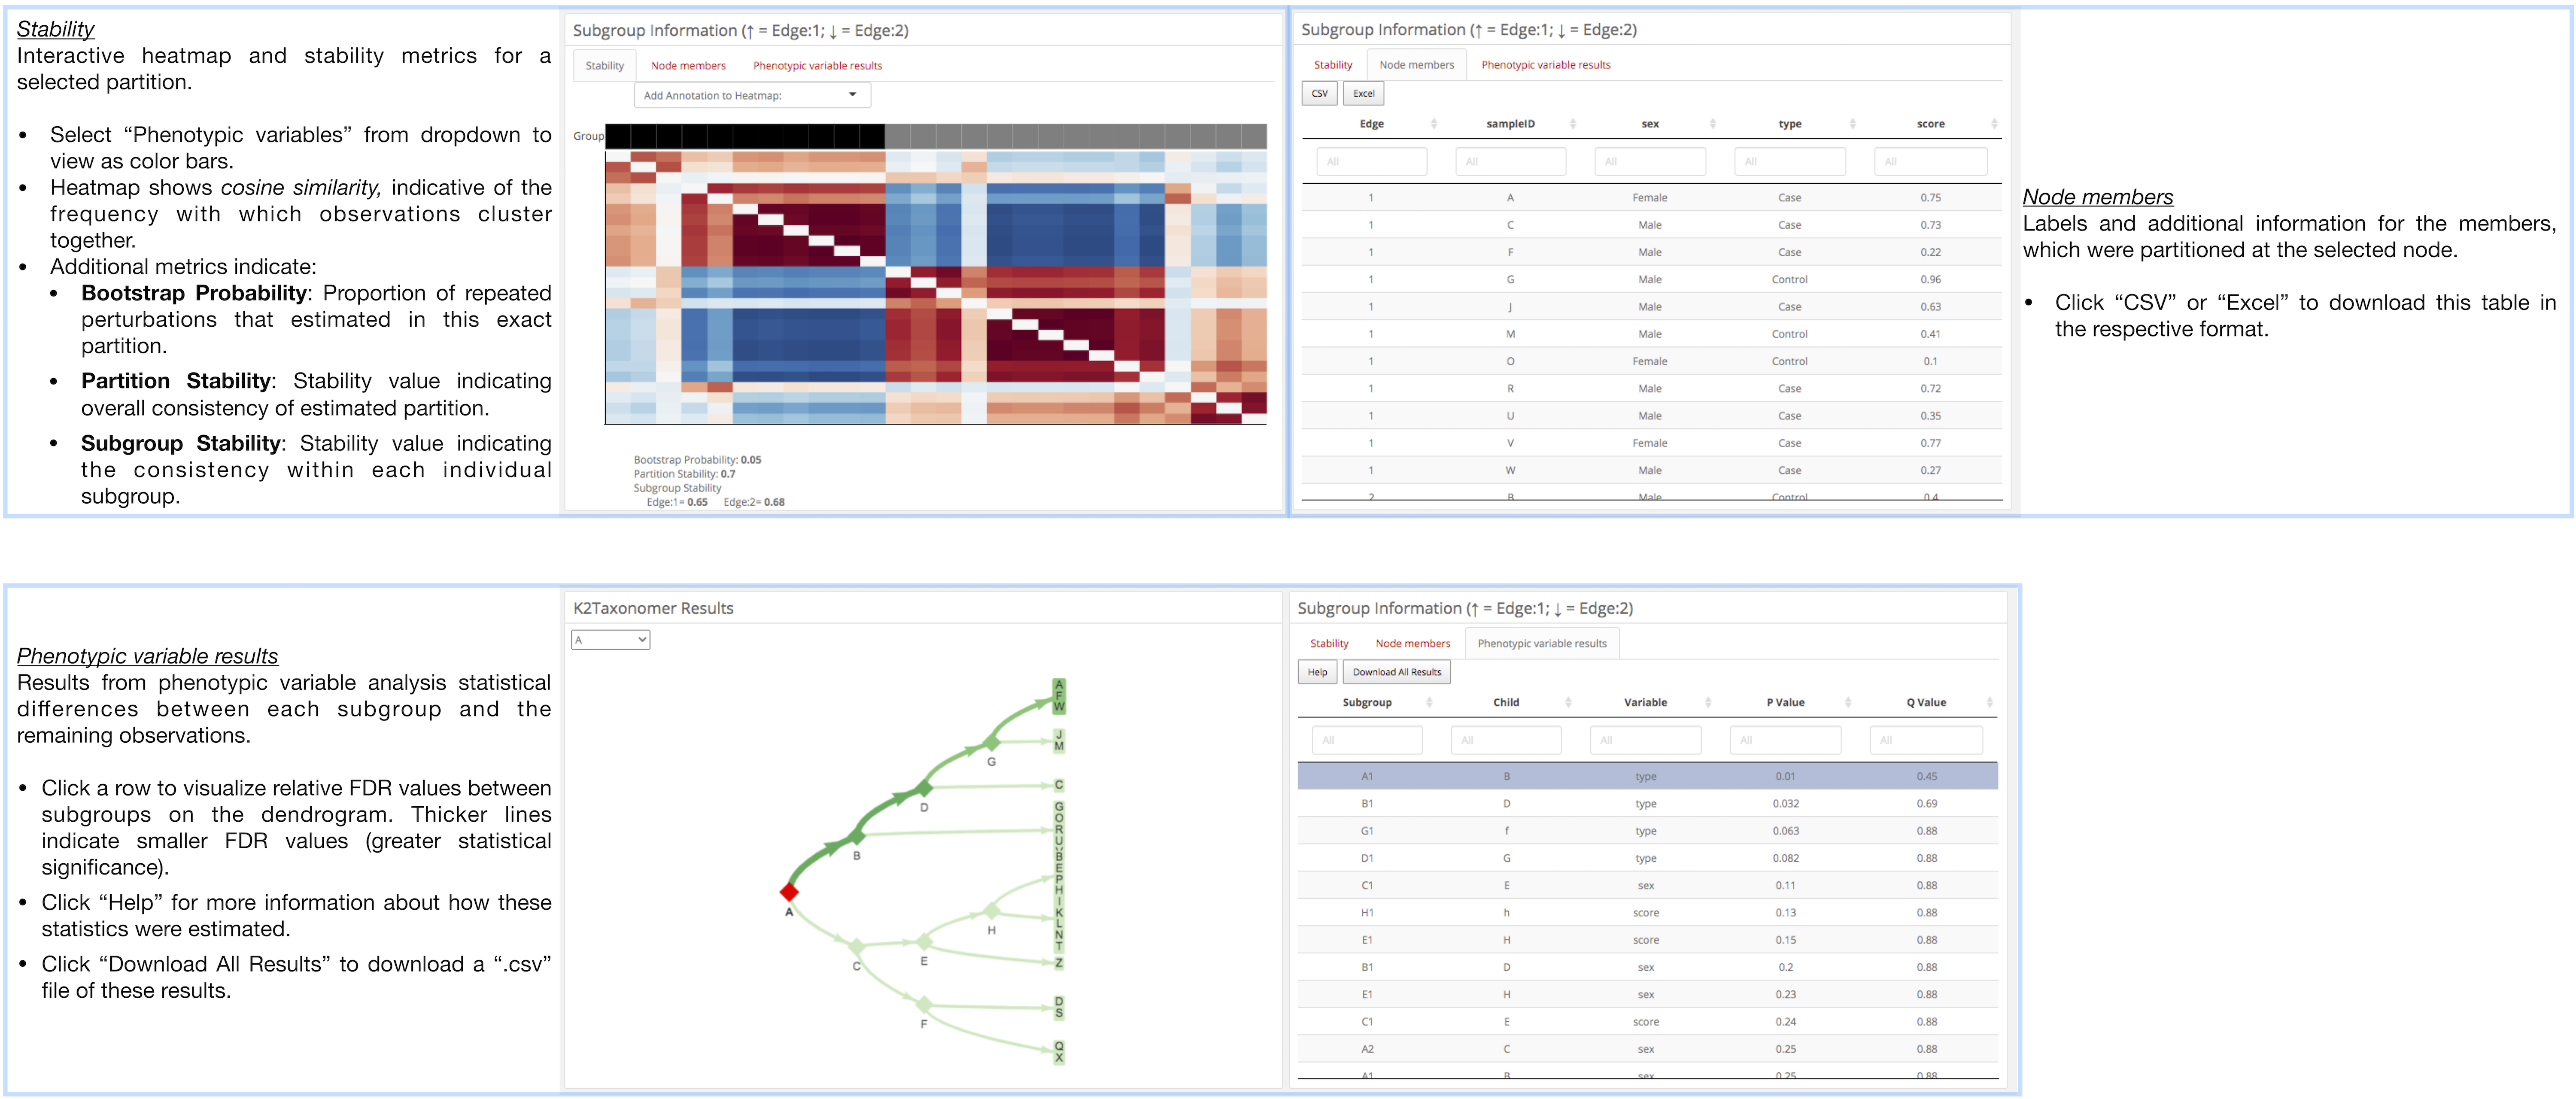
K2Taxonomer Results: This tab includes all of the results generated throughout the K2Taxonomer workflow, including: partitioning results, partition stability, gene expression analysis, gene set enrichment, and phenotypic variable testing (optional). More information for how K2Taxonomer estimates these results can be found here.
Compare Multiple: This tab allows the user to perform additional molecular comparisons between subgroups, beyond the partition-level comparisons performed by K2Taxonomer functions.
Annotation of each of these tabs is presented below. Click on any of these images to view in higher resolution

References
Reed, Eric R., and Stefano Monti. 2020. “Multi-Resolution Characterization of Molecular Taxonomies in Bulk and Single-Cell Transcriptomics Data.” Preprint. Bioinformatics. https://doi.org/10.1101/2020.11.05.370197.